El Niño Solar Boost: What It Means for U.S. Homeowners
Solcast's latest outlook shows El Niño driving stronger solar conditions across Australasia and South Asia. Here's why the broader trend matters for U.S.
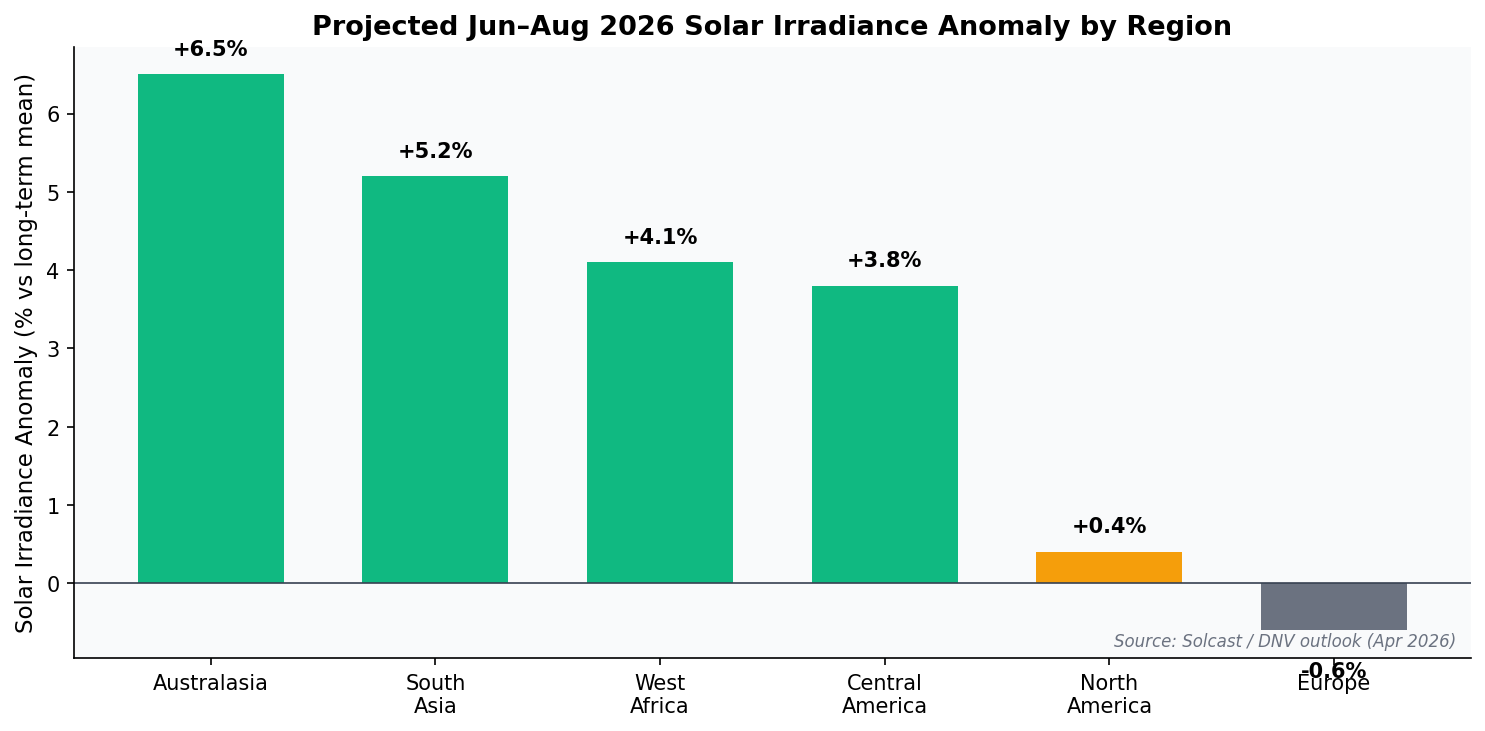
A developing El Niño climate pattern is poised to deliver stronger solar irradiance across Australasia, South Asia, West Africa, and Central America during the June–August 2026 window, according to the latest weekly outlook from Solcast, a DNV company.[1] While the news headline focuses on global solar farms in distant geographies, the underlying story matters for U.S. homeowners too: weather patterns, climate cycles, and local irradiance increasingly shape the economics of rooftop solar — and the smartest time to act is when the data is on your side.
In this article, we unpack what the El Niño-driven solar outlook means for power generation worldwide, why that translates into a clearer case for residential solar-plus-storage in the United States, and how to use EnergyScout's free tools to model your own savings before incentives shift again.
What the Solcast / DNV outlook actually says
Solcast's June–August 2026 outlook indicates mostly neutral-to-positive solar irradiance globally, with notable above-normal conditions in Australasia, South Asia, West Africa, and Central America.[1] These patterns are consistent with a developing El Niño event in the equatorial Pacific, which historically suppresses cloud cover and rainfall across large swaths of the Southern Hemisphere and tropics.
For utility-scale solar developers in those regions, the implication is straightforward: more sunlight, higher capacity factors, and stronger generation revenue. According to the International Energy Agency (IEA), solar PV is now the cheapest source of new electricity generation in most countries, and El Niño-driven irradiance gains can push capacity factors 3–8% higher than long-term averages in affected regions.[2]
Why El Niño matters for U.S. homeowners
The headline winners of this El Niño are overseas, but the broader signal is universal: solar generation is increasingly predictable, financeable, and bankable. The U.S. Energy Information Administration (EIA) reports that solar accounted for more than 7% of U.S. electricity generation in 2024 and is projected to reach roughly 11–12% by the end of 2026.[3] That growth is built on the same modeling tools — like Solcast's — that now show El Niño tailwinds in other markets.
For a homeowner evaluating rooftop solar, three things are happening simultaneously:
- Module prices remain near record lows — the Lawrence Berkeley National Laboratory's Tracking the Sun report shows median installed residential prices stabilizing around $3.30/W after years of decline.[4]
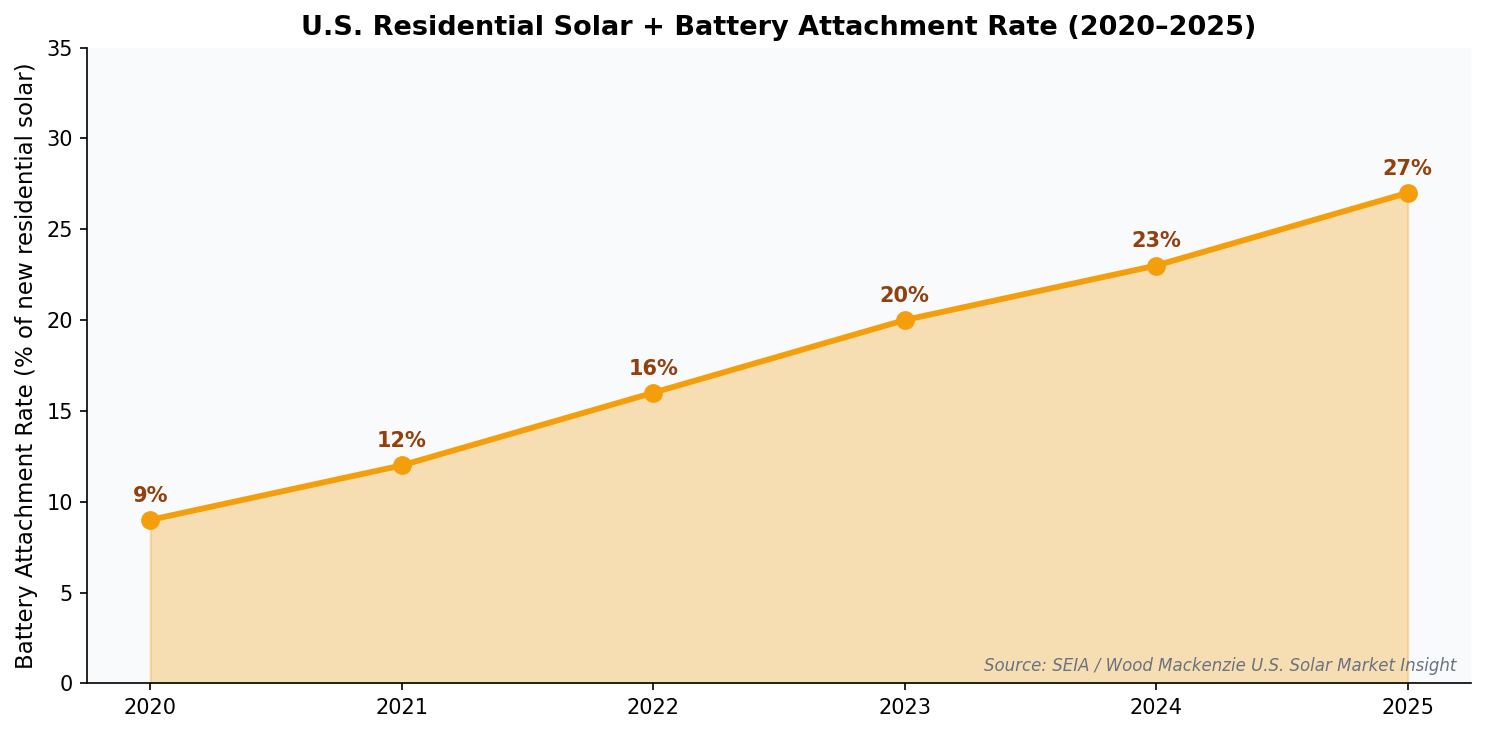
- Battery storage is now standard — SEIA reports that more than 25% of new residential solar installations in 2025 were paired with batteries, up from under 10% in 2020.[5]
- Utility rates keep climbing — EIA data shows U.S. residential electricity rates rose roughly 6% year-over-year in 2025, outpacing inflation.[3]
That combination — cheap panels, mature batteries, and rising utility bills — means the savings math works in nearly every U.S. ZIP code, regardless of which way the equatorial Pacific tips.
The 2026 incentive reality: lease/PPA still qualify
Here's the critical update homeowners need to internalize: the federal 30% Residential Clean Energy Credit (the "ITC") expired for purchased solar systems at the end of 2025. If you buy your panels with cash or a loan in 2026, you cannot claim the 30% federal tax credit on your personal return.
However, the credit is still available indirectly through third-party-owned systems — solar leases and Power Purchase Agreements (PPAs). Under these arrangements, the leasing company or developer claims the commercial ITC (Section 48E) and passes a portion of that value back to you in the form of a lower monthly payment or per-kWh rate.[6]
That structural shift is reshaping the residential market. According to EnergySage, the share of residential solar contracts written as leases or PPAs jumped from roughly 25% in 2024 to over 45% in early 2026 as installers adapted to the new tax landscape.[7]

State and utility incentives, meanwhile, are still very much alive. California's Self-Generation Incentive Program (SGIP) administered by the CPUC offers rebates of up to $1,000/kWh for storage in qualifying disadvantaged communities.[8] New York's NY-Sun, Massachusetts SMART, and dozens of utility-specific battery programs add thousands more in stackable savings. Use EnergyScout's incentives ZIP search to see exactly what your address qualifies for.
How climate-driven irradiance feeds your home savings model
When you run an estimate through a tool like EnergyScout's free solar assessment, the engine pulls long-term irradiance data from NREL's National Solar Radiation Database (NSRDB) — the same federal dataset that informs Solcast's forecasts.[9] That means your projected first-year production already accounts for the typical year's cloud cover and weather variability for your specific latitude.
What El Niño shows is that year-over-year variability matters less than the long-term trendline. Even in a "below normal" irradiance year, a properly sized residential system in the U.S. typically delivers within 5% of its modeled annual output. Over a 25-year warranty period, those small wiggles smooth out and the system pays for itself many times over.
Why solar + battery is the smarter 2026 play
Climate volatility — wildfires, hurricanes, ice storms, grid stress events — is one reason batteries have moved from luxury add-on to mainstream pairing. The U.S. Department of Energy notes that residential battery deployments more than tripled between 2022 and 2025, and now exceed 1.5 GW of installed capacity nationwide.[10]
For the homeowner, the value of a battery shows up in three places:
- Time-of-use bill savings — discharge stored solar during expensive evening peak hours, when utility rates can exceed $0.50/kWh in California and parts of the Northeast.
- Backup power resilience — keep refrigeration, lights, internet, and medical devices running during outages.
- Net-metering adaptation — in NEM 3.0 states like California, where export rates dropped sharply, batteries let you self-consume more of your generation.
Choosing the right installer for the new market
The shift to lease/PPA-dominant financing has changed which questions matter when comparing installer quotes. EnergyScout vets local installers using Google Places ratings, NREL data, and licensing checks, and presents them on the providers directory.

When you talk to installers in 2026, ask:
- What is the all-in lease/PPA escalator (annual price increase)? Aim for 0–2.9%.
- Who is the tax-equity backer, and have they paid out warranty claims on time?
- What battery brand is included, and what is the throughput warranty (kWh cycled, not just years)?
- Will the system be sized for current consumption only, or for future EV / heat-pump load?
What to do this week
Whether or not the developing El Niño turns into a record-strength event, the residential solar opportunity in the U.S. has rarely been better aligned: hardware is cheap, batteries are mature, lease/PPA structures preserve federal incentive value, and state programs continue to reward early adopters.
Three concrete steps:
- Run your numbers with EnergyScout's free solar assessment tool — five minutes, no obligation.
- Look up your local incentives at the ZIP code incentive search.
- Compare 2–3 vetted installers from the EnergyScout providers directory before you sign anything.
Climate cycles will come and go. The smarter play is locking in clean, predictable energy economics for the next quarter-century — starting today at energyscout.org.
Citations
- Solcast / DNV, "Weekly Solar Outlook: June–August 2026," PV Magazine, 24 April 2026.
- International Energy Agency, Renewables 2024 — Analysis and forecast to 2030, IEA, Paris.
- U.S. Energy Information Administration, Short-Term Energy Outlook, April 2026 release.
- Lawrence Berkeley National Laboratory, Tracking the Sun: Pricing and Design Trends for Distributed Photovoltaic Systems, 2025 edition.
- Solar Energy Industries Association (SEIA) / Wood Mackenzie, U.S. Solar Market Insight, Q1 2026.
- U.S. Department of the Treasury & IRS guidance on Sections 25D and 48E of the Internal Revenue Code, post-2025.
- EnergySage, Marketplace Report H2 2025.
- California Public Utilities Commission, Self-Generation Incentive Program (SGIP) handbook, 2026.
- National Renewable Energy Laboratory (NREL), National Solar Radiation Database (NSRDB).
- U.S. Department of Energy, Energy Storage Grand Challenge — Residential Deployment Report, 2025.
More Articles
Chile Hit 75% Solar in March. Here's What U.S. Homeowners Should Take From It
Chile's grid produced 29% of its electricity from solar in March, with peaks at 75%. The bottleneck wasn't generation — it was storage and transmission. Here's the homeowner takeaway.
Read article Solar IncentivesBolivia's New Renewables Law: What It Means for Homeowners
Bolivia's Ministry of Hydrocarbons and Energy unveiled a new draft law to open electricity and renewables markets to private investment. We unpack what's in the bill, why global markets are watching, and what US homeowners can learn from the policy shift.
Read article