Negative Power Prices Hit Record Highs — What It Means for You
Spain and Portugal just hit record negative electricity prices as solar surged 15% year over year. Here's what this European milestone means for U.S.
Spain just logged 397 hours of negative wholesale power prices in the first quarter of 2026 — more than eight times the 48 hours recorded in Q1 2025. Portugal hit 222 hours. Both are all-time records, and they're a direct consequence of Europe's solar boom colliding with mild spring demand. For U.S. homeowners, this isn't just a European story — it's a preview of what's coming to California, Texas, and every other high-solar state. And it's the clearest signal yet that rooftop solar plus battery storage is the winning move.
What Happened on the Iberian Peninsula
According to pv magazine's April 2026 analysis, Europe generated a record 52.6 TWh of solar electricity in Q1 2026 — up 15% year over year. Spain and Portugal, blessed with some of the continent's best irradiance, absorbed a disproportionate share of that growth. Combined with mild spring temperatures and low industrial demand, midday supply regularly overwhelmed demand.
When that happens on a wholesale market, prices don't just drop to zero — they go negative. Generators literally pay grid operators to take their electricity, because it's cheaper than shutting off inflexible assets like nuclear or long-term contracted wind.
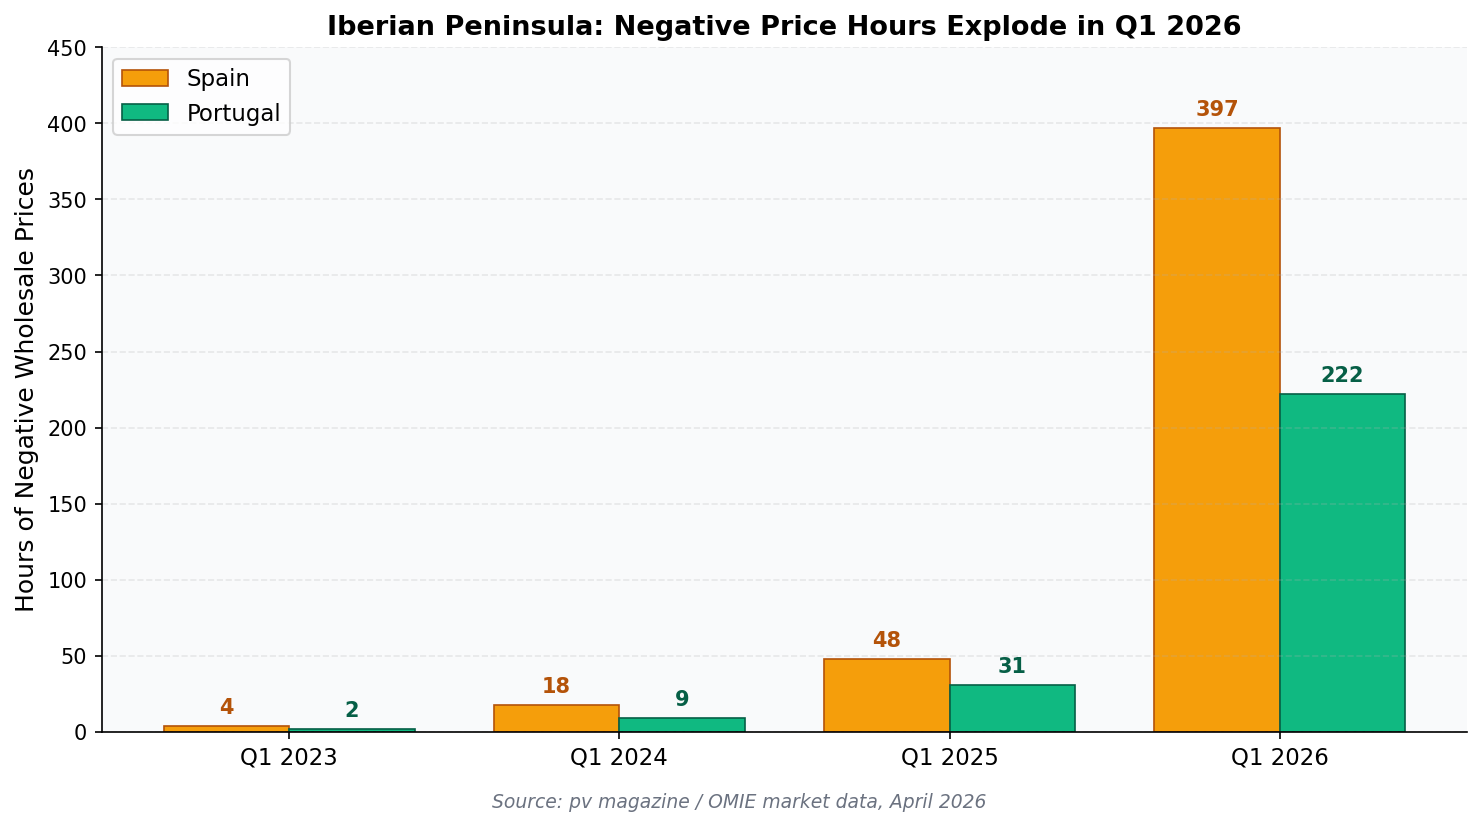
The International Energy Agency (IEA Renewables 2024 report) projected this trajectory years ago. The surprise isn't that it's happening — it's how fast. Spain went from a handful of negative-price hours in 2023 to 397 hours in a single quarter three years later.
Why Negative Prices Are a Feature, Not a Bug
Negative prices aren't a sign solar is failing. They're a sign solar is winning so decisively that the old grid architecture — built around steady fossil baseload — can't keep up. The Lawrence Berkeley National Lab's Utility-Scale Solar Report has documented the same "duck curve" dynamic in California since 2018: midday solar floods the grid, evening demand strains it.
The solution is already clear — shift excess midday generation into the evening. That's exactly what batteries do.
The U.S. Is Next — California Already Saw the Preview
California's CAISO grid hit negative prices for over 1,000 hours in 2024, according to the CPUC and EIA data. Texas ERCOT has seen similar curtailment during spring windy-and-sunny weekends. The U.S. Energy Information Administration (EIA Electric Power Monthly) reports that U.S. utility-scale solar generation grew 25% in 2024 and is on pace for another record in 2026.
For homeowners, this has two immediate consequences:
- Net metering is getting less generous. California's NEM 3.0 cut export credits by roughly 75%. Other states are following. Exporting midday solar to a grid that doesn't need it no longer pays well.
- Time-of-use (TOU) rates are widening. Utilities are pricing evening electricity 3–5x higher than midday. If you can store midday solar and use it at 7 PM, you capture the full spread.
Why Solar + Battery Is the Winning Play in 2026
The economics have flipped. In 2020, a standalone solar system paid back in 6–8 years with net metering. In 2026, a solar-only system in California can take 10+ years to break even under NEM 3.0. But add a battery, and the payback drops to 7–9 years — because you're self-consuming nearly every kilowatt-hour your panels produce.
EnergySage's 2026 marketplace data shows attachment rates for batteries on new residential solar installations hit 62% nationally — up from 12% in 2022. In California, it's over 90%.
The Tax Credit Situation — Read This Carefully
One critical update: the federal 30% Residential Clean Energy Credit (the ITC for homeowners who purchase a system) expired at the end of 2025 under the One Big Beautiful Bill Act. If you're buying a system outright or financing it with a loan in 2026, you can no longer claim the 30% federal credit on your taxes.
However, leases and Power Purchase Agreements (PPAs) still qualify because the credit is claimed by the third-party owner (the leasing company), who then passes the savings through in the form of lower monthly payments. Many state incentives, utility rebates, and storage-specific credits (like California's SGIP) are also still available.

How to Figure Out Your Numbers
The math is different in every ZIP code. A home in Phoenix with 7 kWh/m²/day of sun and TOU rates from APS has a completely different payback than a home in Boston with 4.2 kWh/m²/day and flat Eversource rates. The NREL PVWatts calculator is the gold standard for production estimates, and that's exactly the engine behind EnergyScout's free assessment tool.
Here's a simple three-step process:
- Run a free assessment. Our EnergyScout assessment tool pulls NREL solar data for your exact address, estimates production, and calculates payback under your utility's current rates.
- Search local incentives. Use our ZIP code incentive search to find every rebate, tax credit, and SGIP-style program available at your location.
- Compare verified installers. Our provider directory lists local, vetted companies — no high-pressure door-knockers.
The Bigger Picture: You're Not Too Late
A common worry we hear from homeowners right now: "If negative prices are happening, is solar oversaturated? Am I too late?" Absolutely not. Wholesale negative prices are a utility and grid operator problem. For a homeowner with a south-facing roof and a decent utility bill, the economics are still strongly positive — especially with storage.
Here's why:
- You pay retail rates (often $0.25–$0.45/kWh), not wholesale. Even if midday wholesale is negative, your utility is still charging you retail.
- A battery lets you avoid peak evening rates entirely by using stored solar.
- Grid outages are becoming more frequent — per the DOE's grid reliability data, U.S. customers experienced 5.6 hours of outages on average in 2023, double the 2013 figure. Batteries provide resilience money can't easily buy.
What About the "Solar Is a Scam" Headlines?
Most horror stories trace back to bad sales tactics, not bad technology. Door-to-door reps selling 25-year leases with escalator clauses, inflated system sizes, and hidden dealer fees. SEIA's consumer protection guidelines warn against exactly these patterns. The fix is simple: get multiple quotes from local installers, read every contract carefully, and never sign on the first visit.
How Batteries Flip the Equation
Here's a concrete example. Consider a California household on PG&E's E-TOU-C rate: peak (4–9 PM) is roughly $0.52/kWh, off-peak is around $0.38/kWh. A 10 kW solar system produces about 40 kWh on an average spring day — but under NEM 3.0, exports during the 10 AM–3 PM window are credited at only $0.04–$0.08/kWh. That's a 85% haircut versus retail.
Adding a 13.5 kWh battery (Tesla Powerwall 3 or equivalent) lets you store that midday production and discharge it during the 4–9 PM peak window. Instead of selling 25 kWh at $0.06/kWh ($1.50), you avoid buying 13.5 kWh at $0.52/kWh ($7.02). That's nearly 5x more value from the same solar kilowatt-hour — and it's the reason battery attachment rates exploded after NEM 3.0 took effect.

Who Should Wait vs. Who Should Move Now
Solar isn't right for everyone in every market. You're likely a strong candidate if you have a south, east, or west-facing roof with limited shading, own your home, pay more than $150/month for electricity, and live in a state with TOU rates or high fixed supply charges. If you rent, have heavy shade, or plan to move within 3 years, a PPA or community solar subscription may be a better fit — both still qualify for the federal credit through third-party ownership.
The Bottom Line
Spain and Portugal's negative-price records are the loudest possible signal that solar has won on cost. The next phase — the one U.S. homeowners are entering right now — is about controlling when and how you use that cheap solar electricity. That's the battery story. That's where the savings live in 2026 and beyond.
The homeowners who act now — before every neighbor has a system and utilities finish redesigning rate structures — lock in the best economics for the next 25 years.
Ready to see your numbers?
Get a free, no-pressure solar + battery assessment for your home in under 60 seconds. We use NREL data and your local utility rates — no sales calls unless you ask.
More Articles
Chile Hit 75% Solar in March. Here's What U.S. Homeowners Should Take From It
Chile's grid produced 29% of its electricity from solar in March, with peaks at 75%. The bottleneck wasn't generation — it was storage and transmission. Here's the homeowner takeaway.
Read article Solar IncentivesBolivia's New Renewables Law: What It Means for Homeowners
Bolivia's Ministry of Hydrocarbons and Energy unveiled a new draft law to open electricity and renewables markets to private investment. We unpack what's in the bill, why global markets are watching, and what US homeowners can learn from the policy shift.
Read article