The Real Cost of Doing Nothing: 10 More Years on the Grid
Electricity rates have outpaced inflation for years, and forecasts show another decade of increases ahead.
Most homeowners think of their electric bill the way they think of taxes — annoying, unavoidable, and basically out of their control. But there's a quieter cost that doesn't show up on any single statement: the cost of doing nothing. If you stay 100% grid-tied for the next ten years while rates keep climbing, the numbers add up faster than most people expect.
This isn't a fear-based pitch. It's just math. Let's walk through what the next decade likely looks like for the average U.S. household — and what your options are to take some of that cost off the table.
Where electricity rates are headed
According to the U.S. Energy Information Administration (EIA), the average residential price of electricity rose from 12.89 cents/kWh in 2020 to 16.26 cents/kWh in 2024 — a roughly 26% jump in four years (EIA Electric Power Monthly). That's well ahead of general inflation over the same period.
Looking forward, EIA's Annual Energy Outlook 2024 projects residential electricity prices will continue rising at roughly 2–3% per year through 2035, driven by transmission upgrades, grid hardening against extreme weather, and the buildout needed to serve new data centers and electrified transportation (EIA AEO 2024).
Lawrence Berkeley National Lab's Utility Rate Database work shows the same pattern at the utility level — the majority of investor-owned utilities have filed rate cases requesting increases above inflation, and most have been at least partially approved (LBNL Electricity Markets & Policy).
The 10-year math for a typical household
The U.S. residential average is about 10,800 kWh of electricity per year, per EIA. At today's average rate near 16 cents/kWh, that's roughly $1,728 a year — or $144 a month. Sounds manageable.
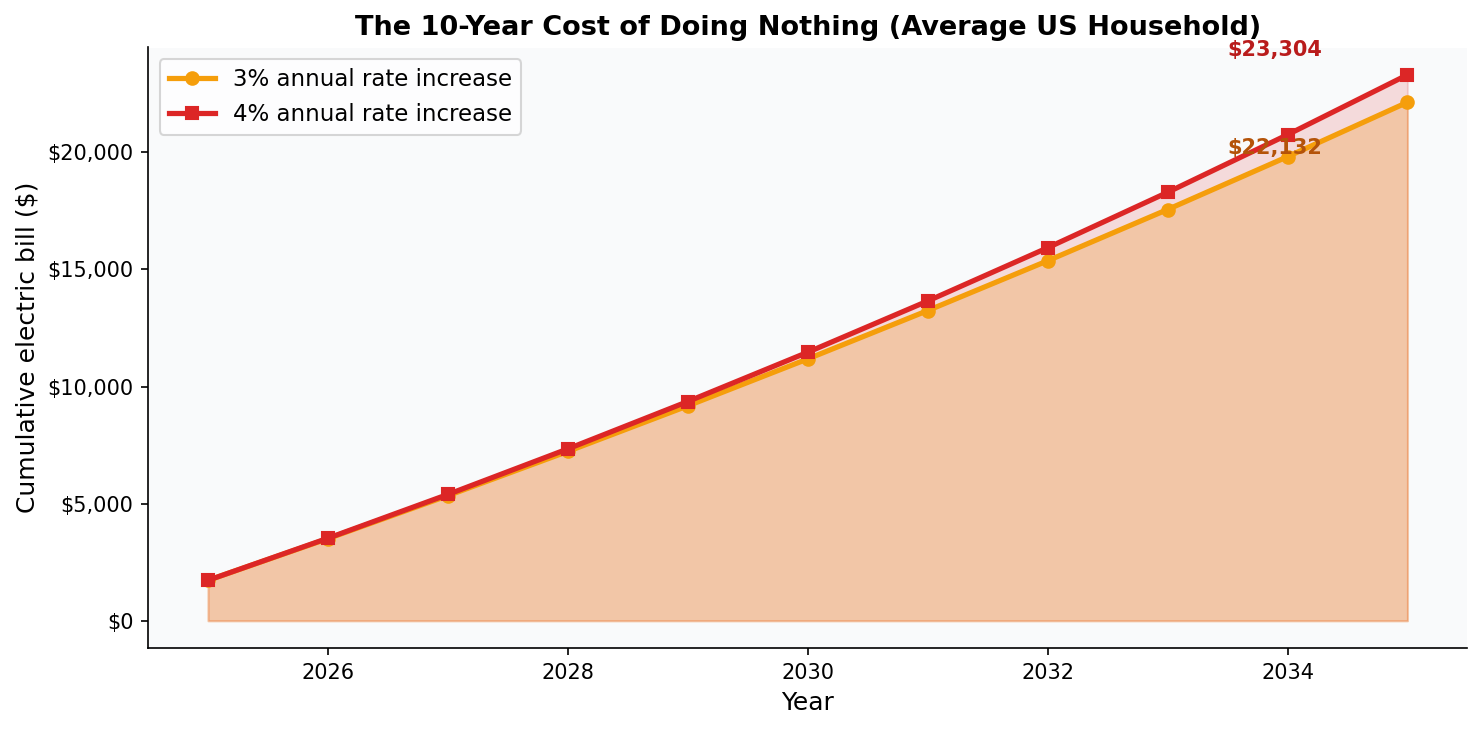
Now compound it. If rates rise 3% annually for the next decade, that same household pays:
- Year 1: ~$1,728
- Year 5: ~$1,946
- Year 10: ~$2,256
- 10-year total: ~$19,800
If rate growth runs closer to 4% — which is what many utilities in California, Hawaii, and the Northeast have actually seen — the 10-year total climbs above $21,000. In high-cost states like California, where average residential rates topped 31 cents/kWh in 2024 (CPUC), the same household easily clears $35,000 over a decade.
That's the cost of doing nothing. Not a worst-case scenario — a base-case, business-as-usual projection.
Why grid costs keep rising
It's not just generation. The Department of Energy notes that more than 70% of U.S. transmission lines are over 25 years old, and the grid will need an estimated $2 trillion in upgrades by 2050 to handle electrification and reliability demands (DOE Grid Deployment Office).
Those costs flow through to ratepayers. Three big drivers:
- Wildfire and storm hardening. Utilities are burying lines and replacing infrastructure after major weather events. CPUC has approved billions in wildfire mitigation costs in California alone.
- Capacity buildout. Data center load is projected to nearly double by 2030 per EIA, and that capacity gets paid for by everyone connected to the grid.
- Aging fleet retirements. Coal plant retirements and natural gas price volatility add uncertainty to wholesale costs that show up in your bill 12–18 months later.
None of these go away. They're structural.
What changed in 2026 — and what didn't
The federal 30% Residential Clean Energy Credit (the “Solar ITC”) for purchased home solar systems expired at the end of 2025. That's real — homeowners buying a system outright in 2026 and beyond no longer claim that 30% federal tax credit.
But here's what most homeowners don't realize: solar leases and Power Purchase Agreements (PPAs) still qualify, because the tax credit is claimed by the third-party owner of the system and passed through as a lower monthly rate. According to EnergySage market data, lease and PPA offers in 2026 are routinely beating utility rates by 20–40% on day one, with locked-in escalators of 0–2.9% versus the utility's open-ended 3–4%.
State and local incentives also still apply. Many states offer additional rebates, property tax exemptions, sales tax exemptions, and net metering that materially change the math (SEIA). You can check what's available in your ZIP code with EnergyScout's incentives search tool.

What “doing something” actually looks like
The point isn't that solar is the only answer. It's that ten years is a long time to absorb compounding rate hikes without a hedge. Homeowners have more options than they used to:
1. Solar lease or PPA (most accessible)
$0 down, locked-in rate, system maintained by the installer. The 30% ITC is preserved for the lessor and passed through. Best for homeowners with good roofs who want predictability without capital outlay.
2. Solar loan or cash purchase
You own the system. No more federal credit in 2026, but state incentives often still apply, and the long-term economics still work in most high-rate states because you eliminate the utility bill rather than just discounting it.
3. Solar + battery
Adds resilience during outages and lets you arbitrage time-of-use rates that are now standard in California, parts of Texas, and growing nationally. NREL's modeling shows battery payback windows have shortened significantly as storage prices fell ~70% from 2018 to 2024 (NREL).
4. Efficiency first
Heat pumps, insulation, and smart thermostats reduce the kWh you need to buy or generate. Often the cheapest first move, especially before sizing a solar system.
How to figure out your number
The right move depends on your roof, your utility rate, your usage, and your local incentives — none of which are the same as your neighbor's. The fastest way to get a personalized read is to run the numbers:
- Pull your last 12 months of utility bills and total the kWh.
- Run a free assessment at energyscout.org/assessment — it uses NREL's PVWatts model and Google data to estimate production and savings for your specific address.
- Check your incentives by ZIP code at solar-battery-incentives-zipcode-search.
- Get matched with vetted local installers via energyscout.org/providers and compare 2–3 quotes before deciding.

The bottom line
Doing nothing isn't free. For the average U.S. household, a decade of business-as-usual electricity bills runs about $20,000 — and meaningfully more in high-rate states. The federal purchase credit may be gone, but lease and PPA structures still capture the ITC value, state incentives still exist, and the underlying economics of generating your own power have only improved as panel and battery costs continue to fall.
You don't have to make a dramatic move. You just have to know what your number actually is. Once you see your 10-year exposure on paper, the decision usually makes itself.
Ready to see your numbers? Run a free, no-obligation assessment in under two minutes at energyscout.org/assessment.
More Articles
Chile Hit 75% Solar in March. Here's What U.S. Homeowners Should Take From It
Chile's grid produced 29% of its electricity from solar in March, with peaks at 75%. The bottleneck wasn't generation — it was storage and transmission. Here's the homeowner takeaway.
Read article Solar IncentivesBolivia's New Renewables Law: What It Means for Homeowners
Bolivia's Ministry of Hydrocarbons and Energy unveiled a new draft law to open electricity and renewables markets to private investment. We unpack what's in the bill, why global markets are watching, and what US homeowners can learn from the policy shift.
Read article