The Real Cost of Doing Nothing: 10 More Years on the Grid
Electricity rates have risen faster than inflation for three straight years. Here's what the next decade on the grid will really cost
When homeowners weigh whether to invest in solar, the conversation usually starts with upfront cost. But there's a second number that rarely gets the attention it deserves: the cost of staying exactly where you are. Over the next ten years, doing nothing isn't actually free — it comes with a rising monthly bill, a shrinking menu of options, and an energy mix you don't control.
This article walks through what the next decade on the grid realistically looks like based on federal data, and lays out the practical, solution-focused steps you can take today to protect your household budget.
The Grid Is Getting More Expensive — Fast
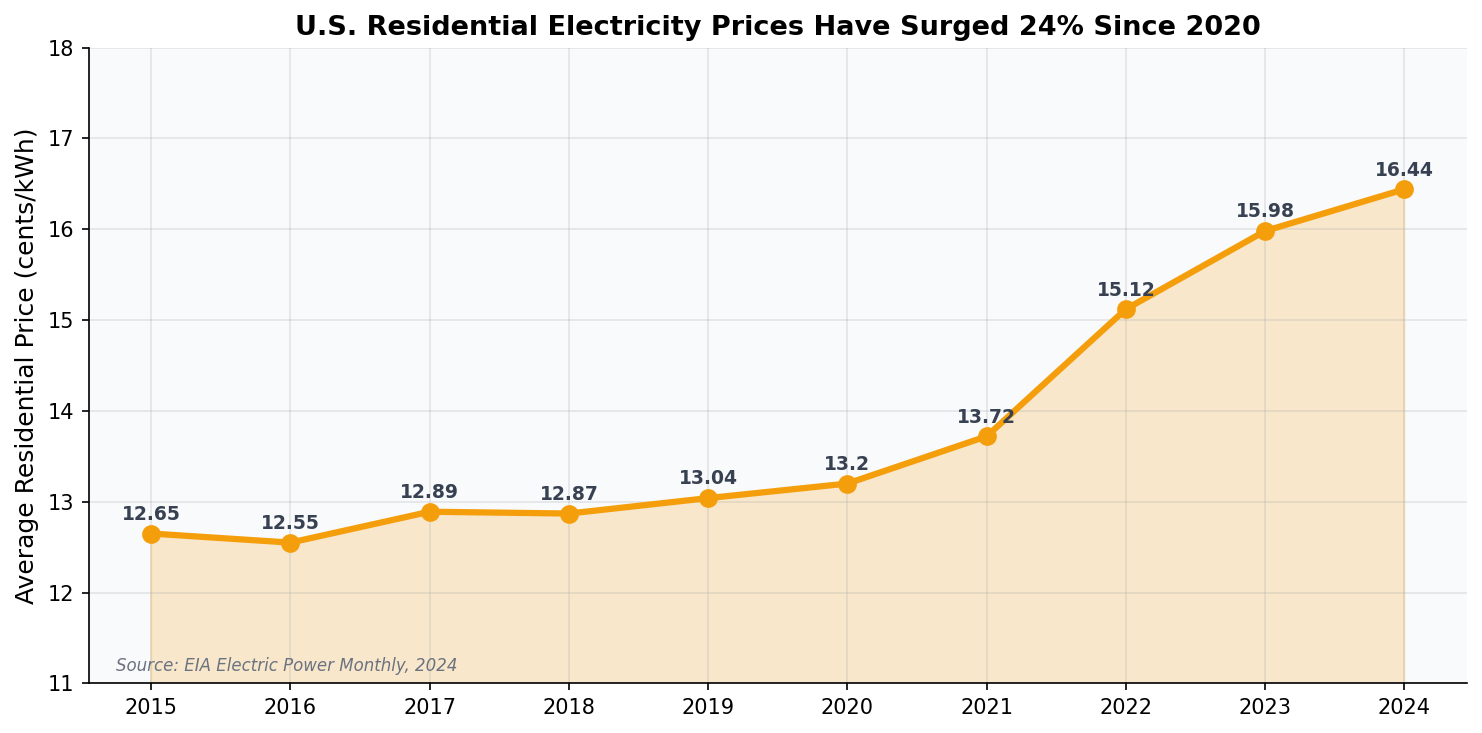
According to the U.S. Energy Information Administration (EIA), the average U.S. residential electricity price rose from roughly 13.2¢/kWh in 2020 to more than 16.4¢/kWh by 2024 — an increase of about 24% in four years (EIA, Electric Power Monthly, 2024). That's faster than overall inflation during the same period.
The Bureau of Labor Statistics reported that electricity was among the fastest-rising components of the Consumer Price Index in 2022 and 2023. And the EIA's 2024 Annual Energy Outlook projects residential retail electricity prices to keep climbing through at least 2035, driven by transmission upgrades, weather-related grid hardening, and fuel volatility.
For a typical household using 10,800 kWh per year (the national average per EIA), even a modest 3% annual price increase compounds into real money. At today's rates, that household pays about $1,770 a year. Ten years from now — assuming a conservative 3% compounding rate — the same usage would cost roughly $2,380. Over the decade, that's more than $20,000 in cumulative electricity spending, with nothing owned at the end of it.
Why Rates Keep Climbing
Grid electricity isn't getting more expensive because of any single villain. It's a combination of structural costs that utilities pass through to ratepayers:
- Transmission and distribution upgrades. The Department of Energy (DOE) estimates that more than 70% of U.S. transmission lines are over 25 years old, and replacing or hardening them is a multi-decade, multi-trillion-dollar project (DOE, National Transmission Needs Study, 2023).
- Extreme weather. NOAA documented 28 separate billion-dollar weather disasters in the U.S. in 2023 alone. Utilities rebuild and ratepayers fund it.
- Fuel volatility. Natural gas still generates about 43% of U.S. electricity (EIA, 2024). When global gas prices spike, your bill follows.
- Capacity expansion for electrification. EV adoption, heat pumps, and data centers are all growing electricity demand at the same time.
None of these trends reverse on their own. The Lawrence Berkeley National Laboratory's 2024 Utility-Scale Solar report notes that while wholesale solar continues to get cheaper, the retail price you pay is dominated by delivery costs — and those are going up.
What 10 More Years on the Grid Actually Looks Like
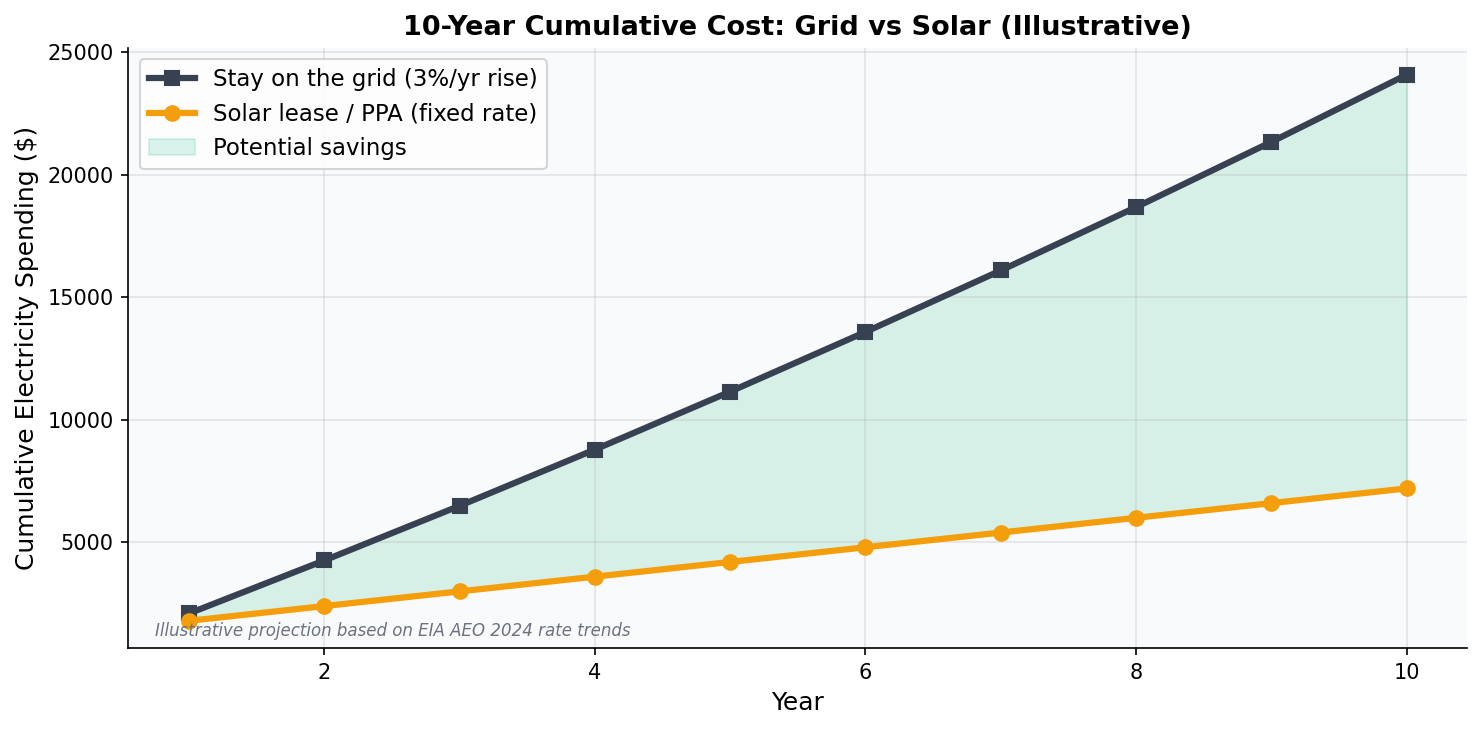
Let's put numbers to it. Here's a realistic projection for a household spending $175 a month today, based on the EIA's long-term outlook:
- Year 1: $2,100
- Year 5: $2,434
- Year 10: $2,821
- 10-year total: ~$24,100
That's money spent on a service you rent, not an asset you own. Meanwhile, the average price of a residential rooftop solar system, according to the National Renewable Energy Laboratory (NREL), has dropped more than 60% since 2010 (NREL, U.S. Solar Photovoltaic System and Energy Storage Cost Benchmark, 2024).
EnergyScout's free home solar assessment uses NREL's PVWatts model plus local utility rate data to show you exactly how your household's 10-year electricity spending compares under two scenarios: staying on the grid, or going solar. Most homeowners are surprised by the difference.
The 2026 Incentive Reset — What Actually Changed
Here's a critical update many homeowners still miss: the federal 30% Residential Clean Energy Credit (Section 25D) for purchased solar systems expired at the end of 2025. For 2026 and beyond, homeowners who buy a system outright no longer receive the 30% federal tax credit.
However, the commercial Investment Tax Credit (Section 48) is still available for third-party-owned systems. That means solar leases and power purchase agreements (PPAs) — where the installer or financier owns the system and you pay a fixed monthly rate — can still pass through ITC savings to customers. For many homeowners, a lease or PPA in 2026 is the most cost-effective path to locking in a lower electricity rate.
State and utility incentives also remain strong in many regions. California's Self-Generation Incentive Program (SGIP) still offers battery rebates, and states like New York, Massachusetts, New Jersey, and Illinois have robust local credits. The EnergyScout incentive search tool lets you enter your ZIP code to see every local rebate, performance payment, and net-metering policy available where you live.

The Hidden Cost: Losing Optionality
Beyond the dollar amount, ten more years on the grid means ten more years of:
- No rate lock. Your utility sets the price; you pay it.
- No backup during outages. The average U.S. customer experienced 5.6 hours of power interruption in 2022 (EIA, Annual Electric Power Industry Report, 2023) — and that number has been rising.
- No asset. Every dollar paid is gone. A solar system, by contrast, adds resale value. Zillow research has consistently shown solar homes sell for roughly 4% more on average.
- No control over your energy mix. You get whatever the grid gives you.
The Solution-Focused Path Forward
Doing nothing isn't neutral — it's a choice with a compounding price tag. The good news is that homeowners today have more tools than ever to evaluate alternatives without pressure or guesswork.
Here's a clear, three-step framework:
1. Benchmark your current 10-year grid cost
Take your last 12 months of electricity bills, average the monthly total, and project it forward with a 3% annual increase. That's your honest baseline.
2. Get an unbiased assessment
EnergyScout uses NREL solar-production modeling and your actual utility rates — not sales assumptions — to calculate real savings. The free assessment takes about 90 seconds and produces a side-by-side comparison you can keep.
3. Compare vetted local installers
Price variance between installers in the same ZIP code can be 30% or more, according to EnergySage's 2024 marketplace data. EnergyScout's installer directory shows pre-screened local providers, their specialties, and verified reviews so you can request quotes from the strongest candidates in your area.

You Have More Leverage Than You Think
The grid isn't the enemy — it's an aging, rate-rising system that was never designed around your household budget. For decades, homeowners didn't have a choice. Today you do. Between lease/PPA financing still backed by the commercial ITC, strong state incentives in most regions, and solar hardware that's 60% cheaper than it was in 2010, the math has rarely looked better for taking control.
Ten more years on the grid is a real cost. It just shows up one monthly bill at a time. The empowering news is that you can get an honest, no-pressure picture of your alternatives in under two minutes.
Ready to see your 10-year numbers? Start with EnergyScout's free home solar assessment — it's completely free, there's no sales call required, and the comparison is yours to keep. Visit energyscout.org to take back control of your energy future.
More Articles
Chile Hit 75% Solar in March. Here's What U.S. Homeowners Should Take From It
Chile's grid produced 29% of its electricity from solar in March, with peaks at 75%. The bottleneck wasn't generation — it was storage and transmission. Here's the homeowner takeaway.
Read article Solar IncentivesBolivia's New Renewables Law: What It Means for Homeowners
Bolivia's Ministry of Hydrocarbons and Energy unveiled a new draft law to open electricity and renewables markets to private investment. We unpack what's in the bill, why global markets are watching, and what US homeowners can learn from the policy shift.
Read article