Silicon Solar Panels Are Heading to Space. Here's What That Means for Your Roof.
Dutch researchers and Airbus are adapting rooftop-grade silicon panels for satellites. The same cost curve driving that decision is reshaping residential solar economics — here's the math, by the numbers.
The Netherlands Organization for Applied Scientific Research (TNO) just announced a partnership with solar manufacturer MCPV and aviation giant Airbus to send silicon photovoltaic panels — the same kind on rooftops across the U.S. — into orbit. The goal: replace expensive gallium arsenide space cells with cheaper terrestrial silicon. It sounds like a niche aerospace story, but it's actually a useful window into where solar economics are heading on Earth, too.
Here's why a homeowner in Phoenix or Pittsburgh should care: the same cost curve that makes silicon attractive for satellites is the curve that's already reshaping your utility bill.
The news, in plain numbers
For decades, satellites used gallium arsenide (GaAs) solar cells because they're roughly 30–34% efficient and tolerant of radiation. The catch: GaAs cells cost something like 100x more per watt than silicon. According to the National Renewable Energy Laboratory's Champion Photovoltaic Module Efficiency Chart, top-tier crystalline silicon now exceeds 26.8% lab efficiency — close enough to GaAs that the cost gap matters more than the efficiency gap (NREL, 2024).
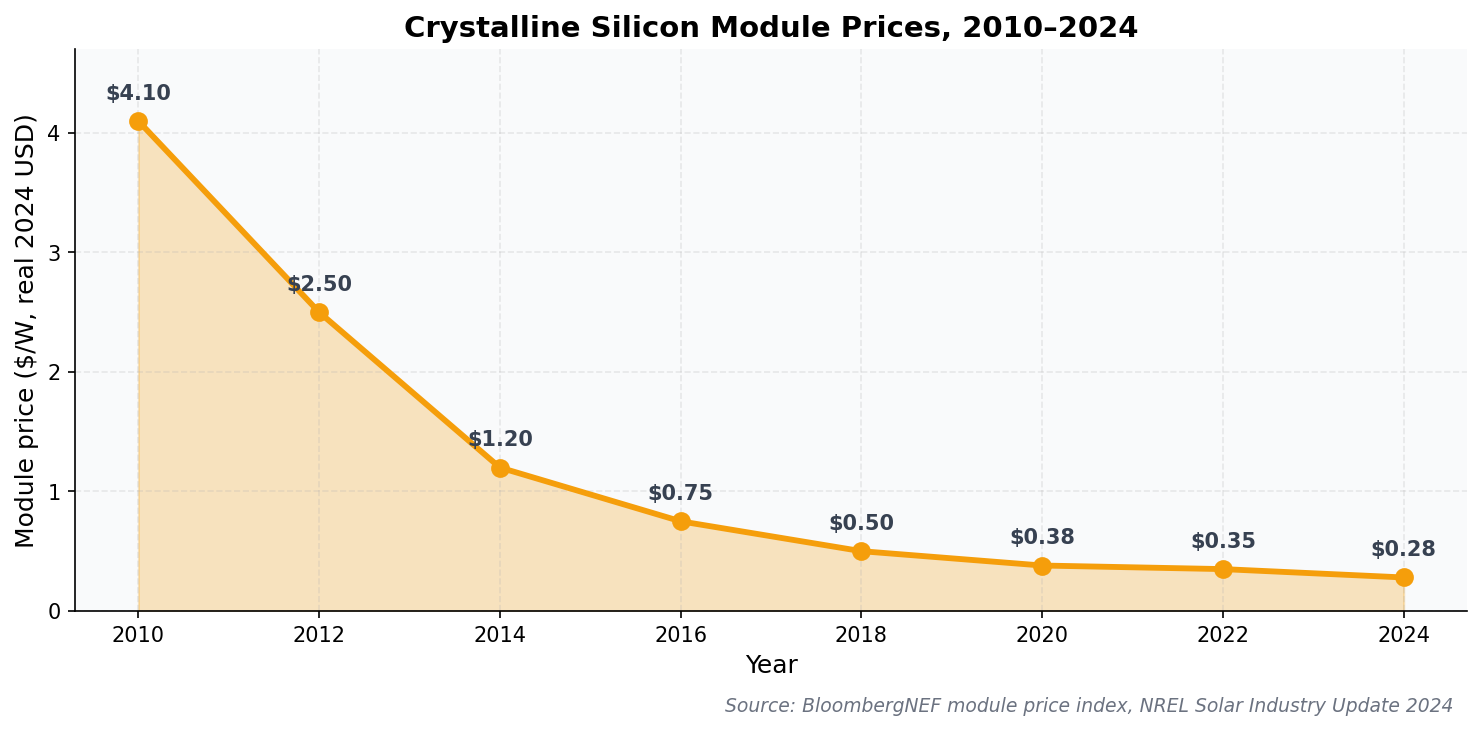
That's the same story playing out on rooftops. Silicon panels cost less than $0.30 per watt at the module level (BloombergNEF Q4 2024 module price index), down from over $4/W in 2010. Installed residential cost is now around $2.85/W before incentives (Lawrence Berkeley National Laboratory, Tracking the Sun 2024).
Why this matters for your roof
The TNO–Airbus project isn't going to lower your power bill. But it confirms a trend that already does: silicon has become so cheap and reliable that even space agencies are switching to it. For a homeowner, the practical effect is simple — solar arrays that would have cost $40,000 a decade ago now run $18,000–$22,000 for a typical 7 kW system before any incentives (EnergySage Marketplace Report, H2 2024).
The math on a 7 kW system
Let's run an actual case. A 7 kW silicon array in a sunny zip code (Phoenix, AZ) produces roughly 11,500 kWh/year per the NREL PVWatts calculator. At Arizona's average residential rate of $0.155/kWh (U.S. Energy Information Administration, Electric Power Monthly, March 2025), that's about $1,780 in avoided electricity per year.
- System cost (cash purchase): ~$19,950 ($2.85/W × 7,000 W)
- Annual production: 11,500 kWh
- Annual savings: ~$1,780
- Simple payback: ~11.2 years
A homeowner in a higher-rate market like California or Massachusetts ($0.32/kWh and $0.34/kWh respectively, per EIA) sees that payback drop to 6–7 years.
The federal incentive picture in 2026
Here's the part that's changed and a lot of older articles get wrong: the 30% federal Residential Clean Energy Credit (the "ITC") expired for purchased systems at the end of 2025. If you bought and installed a system in 2026, you can no longer claim that 30% credit on your federal return for a cash or loan purchase.
What still qualifies for federal tax benefits is third-party owned systems — solar leases and power purchase agreements (PPAs). In those structures, the leasing company owns the panels and can claim the commercial Investment Tax Credit (Section 48), often passing some of the savings back to homeowners through lower monthly payments. The IRS guidance on this is in Notice 2024-41 and the FAQ on Form 5695.
State-level programs are very much alive. New York's NY-Sun rebate, California's SGIP for batteries, Massachusetts' SMART tariff, and dozens of state-level property and sales tax exemptions all continue. The Database of State Incentives for Renewables & Efficiency (DSIRE) tracks these by zip code.
What "space-grade silicon" tells us about reliability
The TNO project also speaks to an underappreciated fact: silicon PV is durable. Module manufacturers now routinely warranty 25–30 years of production at 85%+ of nameplate capacity. NREL's long-term reliability studies (Jordan & Kurtz, 2022) show median annual degradation of just 0.5%/year — meaning a panel installed today should still produce ~88% of its original output in year 25.
That durability assumption matters when you compare a solar lease (~$80–$120/month for 20–25 years) to ownership. Over 25 years, a $20,000 cash system in California can return $50,000+ in net electricity savings, depending on rate inflation. The catch is the upfront capital — and now, without the federal ITC for purchases, that capital decision has gotten harder.
Where batteries change the calculation
One reason to slow down before signing anything: utilities are restructuring net metering faster than most homeowners realize. California's NEM 3.0 (now formally "Net Billing Tariff") cut export compensation by roughly 75% for new solar customers (CPUC Decision 22-12-056, December 2022). That made standalone solar significantly less attractive — but it made solar + battery more attractive, because storing your own power and using it after sundown is now worth far more than exporting it.
For a typical California household, adding a 13.5 kWh battery (around $13,000–$16,000 installed) shortens overall payback to roughly the same 8–10 years that pre-NEM-3.0 solar-only systems used to deliver — but only if you size the battery to your evening load. EnergyScout's free assessment tool walks through this sizing math automatically.
How to actually run the numbers for your home
The space-PV news is a useful reminder: the underlying technology is mature, cheap, and getting cheaper. What varies dramatically is your local picture — your roof's solar resource, your utility's rates, your state's rebates, and whether your utility offers favorable net metering or has moved to net billing.
A short checklist before you talk to any installer:
- Pull your last 12 months of utility bills. You need annual kWh consumption — not just dollars. Solar is sized to kWh.
- Check your zip code's solar resource. NREL's PVWatts gives you a free production estimate based on your roof tilt and orientation.
- Look up local incentives. DSIRE and EnergyScout both index state, utility, and local rebates by zip code.
- Get at least three installer quotes. EnergySage data shows price spreads of 20–40% between installers in the same market.
- Decide ownership vs. lease honestly. Without the federal ITC, the math has shifted — leases and PPAs now have a stronger relative case for many households.
The bigger picture
Silicon photovoltaics started as a space technology in the 1950s — the Vanguard 1 satellite, launched in 1958, was the first practical use. Then it migrated to Earth, scaled up by a factor of millions, and got 99% cheaper. Now it's heading back to space because the Earth-scale economics finally beat the boutique aerospace economics. That round trip is a small but telling data point: silicon PV is no longer an exotic technology. It's commodity infrastructure.
For homeowners, that means the question isn't whether solar works. It's whether the specific math — your rates, your roof, your state's incentives, your financing options — adds up for your house.
If you want a free, no-obligation read on those numbers, you can run your address through EnergyScout's solar + battery assessment tool. It pulls NREL production data for your roof, layers in your state and utility incentives, and shows you the realistic 25-year cost picture — including the post-ITC reality for 2026 buyers. No installer call required to see the numbers.
energyscout.org — run the numbers for your home.
More Articles
Do Solar Panels Work During a Power Outage?
Most homeowners assume solar panels keep the lights on when the grid goes down. The actual answer surprises people — and the fix is simpler than you think.
Read article Battery StorageChile Hit 75% Solar in March. Here's What U.S. Homeowners Should Take From It
Chile's grid produced 29% of its electricity from solar in March, with peaks at 75%. The bottleneck wasn't generation — it was storage and transmission. Here's the homeowner takeaway.
Read article