Spain's Negative Power Prices Signal a Solar + Storage Boom
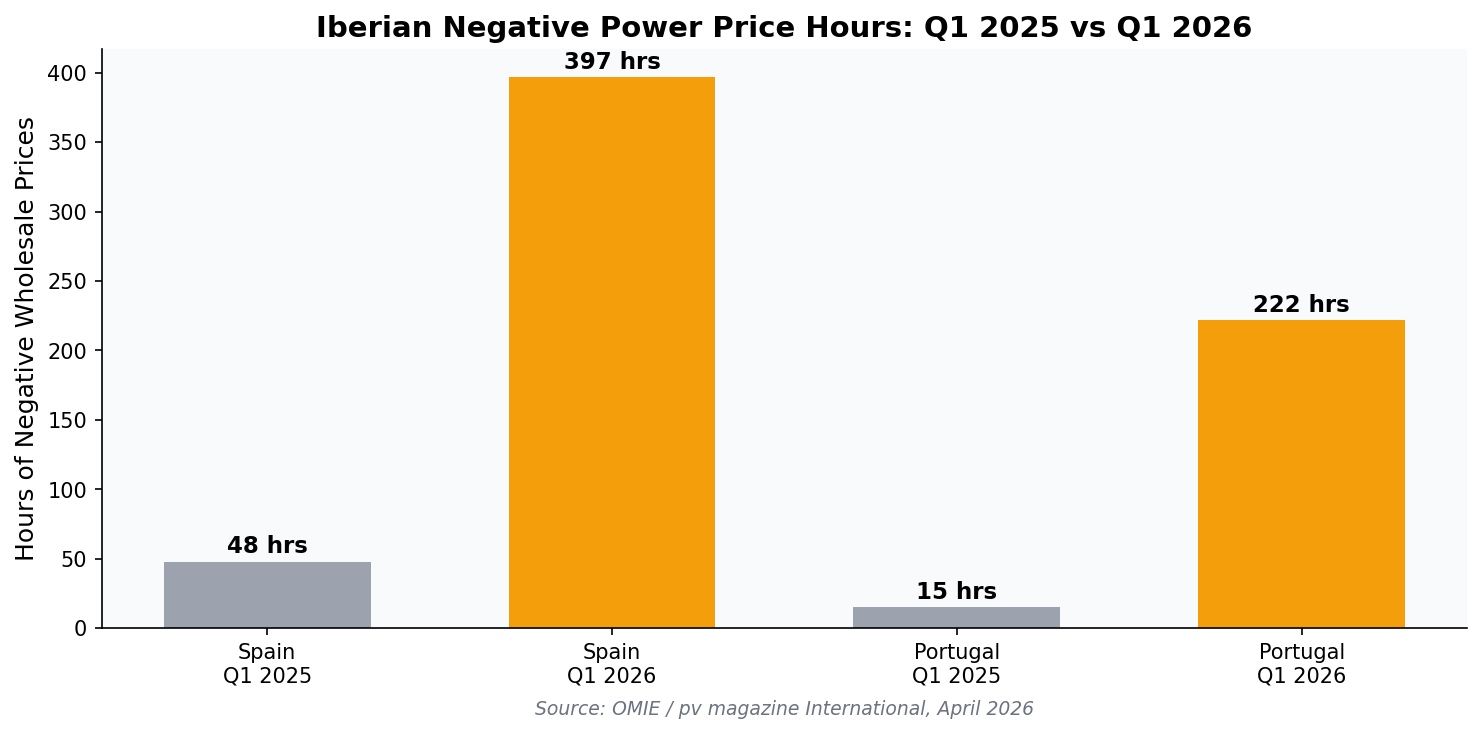
Spain logged a record 397 hours of negative wholesale power prices in Q1 2026 as European solar output hit 52.6 TWh.
Something remarkable happened on the Iberian Peninsula this past quarter: electricity prices went negative — meaning generators had to pay to put power on the grid — for 397 hours in Spain and 222 hours in Portugal during Q1 2026. That's more than eight times the 48 negative-price hours Spain logged in Q1 2025, and it's an all-time high for both countries (pv magazine International, April 2026).
The cause? A record-shattering 52.6 TWh of European solar generation in Q1 — up 15% year over year — colliding with mild spring weather and low demand. It's a preview of what's coming to high-solar U.S. markets like California, Texas, and the Southwest. And for homeowners, it's one of the clearest signals yet that pairing solar with battery storage is the smart play for 2026 and beyond.
What "Negative Prices" Actually Mean for Homeowners
On wholesale electricity markets, negative prices occur when supply vastly exceeds demand and generators would rather pay to keep running than shut down and restart later. In Spain and Portugal, the abundance of midday solar output — combined with inflexible baseload plants and limited storage — pushed prices below zero for the equivalent of more than 16 full days in just three months (OMIE Iberian Market Operator, 2026).
Here's the catch for U.S. homeowners: retail electricity bills rarely reflect those midday lows. Utilities still charge peak rates from 4–9 p.m., when the sun is setting and demand is climbing. That gap — cheap (or free) solar midday, expensive grid power at dinner — is exactly where battery storage turns a modest system into a serious money-saver.
The "Duck Curve" Goes Global
Grid operators have long warned about the so-called "duck curve" — a daily demand pattern where net load (total demand minus solar) dips hard at noon and spikes steeply at sunset. California's grid operator, CAISO, first documented this phenomenon a decade ago (California ISO, 2016). Now Iberia is living it at a national scale, and the U.S. Energy Information Administration projects a similar pattern emerging across ERCOT (Texas) and the Southwest as solar penetration climbs past 25% (EIA Short-Term Energy Outlook, 2025).
Why This News Is Good for Your Solar + Battery Decision
If utility-scale solar is so abundant it's driving wholesale prices negative, why should you put panels on your roof? Three reasons:
- Retail rates aren't falling. Even with record solar generation, U.S. residential electricity prices rose 4.8% in 2024 and are projected to climb again in 2026 (EIA, 2025). Utility fixed charges, transmission upgrades, and peak-demand pricing insulate your bill from wholesale swings.
- Net metering is shrinking. As more homeowners export midday solar, utilities are pushing back. California's NEM 3.0 slashed export credits by roughly 75% for new customers (CPUC, 2023), and similar reforms are in motion in Arizona, Florida, and North Carolina.
- Time-of-use rates reward storage. When you charge a battery with midday solar and discharge during the 4–9 p.m. peak, you're arbitraging the same spread that makes negative wholesale prices possible — only you capture the value instead of losing it.
The 2026 Federal Incentive Landscape (Read This Carefully)
Here's critical news many homeowners haven't caught up with: the federal 30% Investment Tax Credit (ITC) for purchased residential solar systems expired at the end of 2025. That means if you buy your system outright or finance it with a loan in 2026, you no longer qualify for the 30% credit that powered the solar boom from 2022–2025.
However — and this is a big however — leases and power-purchase agreements (PPAs) still qualify because the tax credit flows to the system owner (the leasing company), who typically passes the savings through in the form of lower monthly payments. For many homeowners in 2026, a lease or PPA is now the most cost-effective way to go solar without losing the incentive entirely.
State and utility incentives are a different story. Rebates, property-tax exemptions, sales-tax exemptions, and SREC markets are still active in dozens of states. The Lawrence Berkeley National Laboratory's Tracking the Sun report found that state-level incentives can stack to offset 20–40% of system cost in the most generous markets (LBNL, 2024).

EnergyScout's incentive search tool pulls live data for your ZIP code so you can see exactly which state, utility, and local programs stack in your area before you talk to an installer.
Battery Storage: From "Nice to Have" to "Essential"
The Iberian story is really a storage story. Spain's installed battery capacity is still below 2 GW, far short of what's needed to soak up midday solar and shift it to evening peaks. The European Commission has set a target of 200 GW of EU battery capacity by 2030 to address exactly this mismatch (European Commission Clean Industrial Deal, 2024).
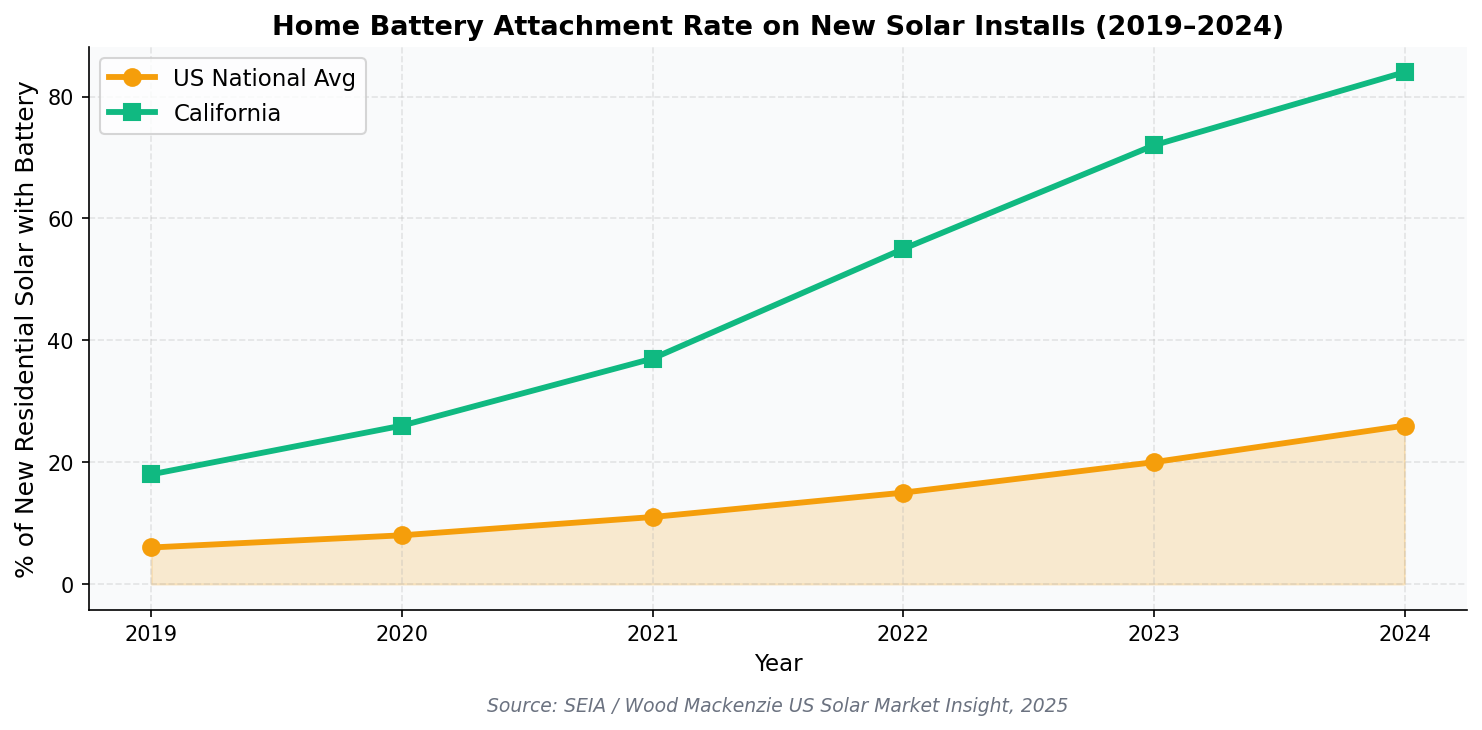
U.S. residential storage is growing fast too. According to the Solar Energy Industries Association, attachment rates for home batteries on new solar installs crossed 25% nationally in 2024, with some markets (Hawaii, California, Puerto Rico) exceeding 80% (SEIA/Wood Mackenzie U.S. Solar Market Insight, 2025).
What a Battery Actually Does for Your Bill
On a time-of-use rate plan, a typical 10 kWh home battery can:
- Shift 8–10 kWh per day from off-peak/solar hours to on-peak hours, saving $1.50–$3.00 daily depending on rate spread
- Provide 8–24 hours of backup during outages — increasingly valuable as climate-driven grid events rise
- Qualify you for utility demand-response and VPP (virtual power plant) payments of $500–$2,000 per year in participating markets (NREL, 2024)
The National Renewable Energy Laboratory's ResStock modeling suggests that adding storage to a rooftop system improves lifetime economic value by 15–35% in time-of-use regions, even without the federal ITC (NREL ResStock, 2024).
What This Means for Your Next Move
The Iberian negative-price headlines are a leading indicator. Here's how to translate them into action:
1. Size Your System Around Self-Consumption, Not Export
If net-metering credits are shrinking, the smart play is sizing your system to cover what you can self-consume (with a battery) rather than oversizing for export. EnergyScout's free assessment tool runs the math for your roof, usage pattern, and local rate structure.
2. Get at Least Three Quotes
EnergySage data consistently shows that homeowners who get 3+ quotes save an average of $5,000–$8,000 versus those who take the first offer (EnergySage Solar Marketplace Report, 2024). Our vetted provider directory lets you compare certified installers in your area without the sales-pressure funnel.

3. Prioritize Installers Who Understand Storage Economics
Not every solar installer is a storage expert. Ask any installer you're considering: "What time-of-use plan does my utility offer, and how will you size the battery to maximize the peak-shift savings?" If they can't answer, keep looking.
The Bigger Picture
Spain and Portugal's negative-price quarter isn't a warning sign — it's a success story with a missing chapter. Clean energy is winning on cost, and the places with the most aggressive solar deployment are now racing to build the storage and transmission that lets them capture all that cheap electricity instead of curtailing it.
For U.S. homeowners, the takeaway is simple: the era of "solar alone" is ending, and the era of "solar + storage + smart rate plans" is here. The households that get this right in 2026 will lock in 20+ years of hedged energy costs while their neighbors keep absorbing whatever the utility charges.
The Department of Energy projects that distributed solar + storage could supply up to 45% of U.S. electricity by 2050 if deployment trends continue (DOE Solar Futures Study, 2021). Homeowners who act now — with the right system design and incentive stack — will be the backbone of that transition.
Ready to See What Your Roof Can Do?
EnergyScout's free tools pull real data from NREL, your utility, and state incentive databases to give you a straight answer on solar + battery economics for your specific address. No sales calls, no pressure — just the numbers.
Start with a free assessment at energyscout.org and see exactly how much you could save before talking to an installer.
More Articles
Chile Hit 75% Solar in March. Here's What U.S. Homeowners Should Take From It
Chile's grid produced 29% of its electricity from solar in March, with peaks at 75%. The bottleneck wasn't generation — it was storage and transmission. Here's the homeowner takeaway.
Read article Solar IncentivesBolivia's New Renewables Law: What It Means for Homeowners
Bolivia's Ministry of Hydrocarbons and Energy unveiled a new draft law to open electricity and renewables markets to private investment. We unpack what's in the bill, why global markets are watching, and what US homeowners can learn from the policy shift.
Read article