Which States Lead on Wind and Solar? The Map Will Surprise You
California and Texas grab the headlines, but the states with the highest wind and solar share aren't who you'd expect. Here's the data — and what it means for your roof.
If you had to guess which U.S. state generates the largest share of its electricity from wind and solar, you'd probably say California or Texas. You'd be wrong on both counts. According to the latest U.S. Energy Information Administration (EIA) data analyzed by Canary Media, Iowa, South Dakota, and Kansas top the list — each pulling more than half of their in-state electricity generation from wind alone.1
This matters for homeowners more than it might seem. The states leading the renewable transition tend to have cheaper wholesale electricity, more aggressive net-metering rules, and faster permitting for rooftop solar. So before you write off your own state's solar potential, look at the numbers.
The actual top 10 (and why it's not who you think)
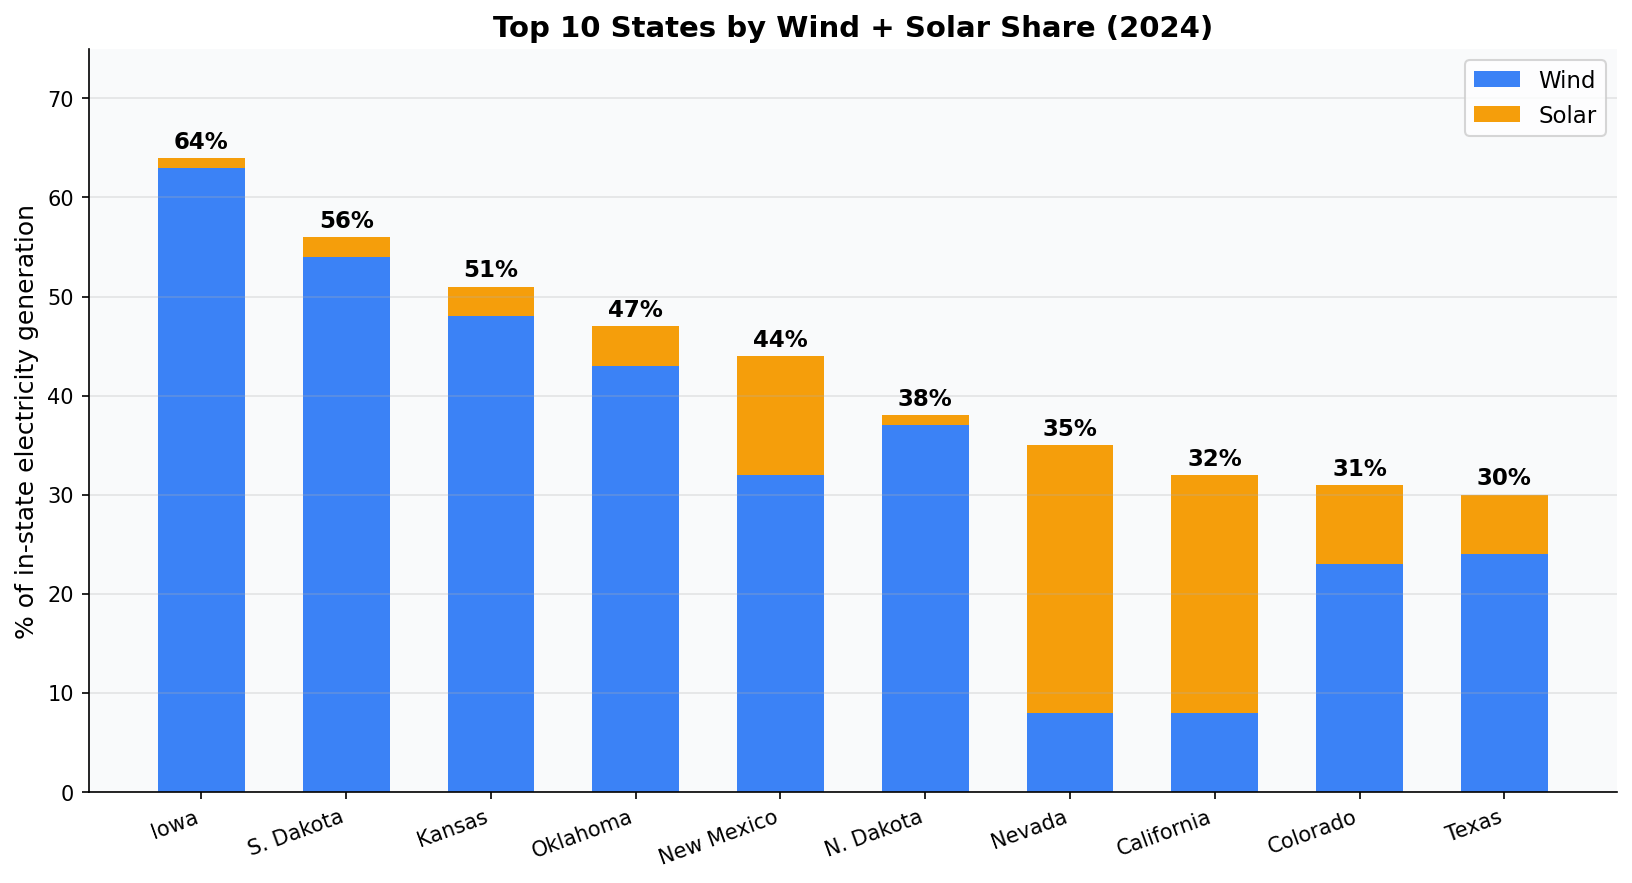
Here's the 2024 ranking by combined wind + solar share of in-state generation, per EIA:2
- Iowa — 64% (almost entirely wind)
- South Dakota — 56%
- Kansas — 51%
- Oklahoma — 47%
- New Mexico — 44%
- North Dakota — 38%
- Nevada — 35% (largest solar share of any state)
- California — 32%
- Colorado — 31%
- Texas — 30%
Texas generates more raw kilowatt-hours of wind and solar than any other state — by a wide margin — but it also consumes a massive amount of electricity overall. So in percentage terms, the Plains states win.
Why the wind belt dominates
The Great Plains sit on what the Department of Energy calls the "wind corridor" — a 1,500-mile strip from North Dakota to Texas with average wind speeds above 7 m/s at 80 meters of hub height.3 That's the sweet spot for utility-scale turbines. Iowa alone has more than 6,000 turbines installed, totaling over 12 GW of capacity.4
For homeowners in these states, the upshot is twofold: wholesale power prices are often lower (Iowa's average residential rate is about $0.13/kWh vs. the national average of $0.17/kWh per EIA), and the grid mix is already cleaner — meaning every kWh you offset with rooftop solar has a smaller carbon footprint to begin with.5
Solar's quieter rise — Nevada and California lead
Wind dominates the top of the list, but solar is closing the gap fast. Nevada now gets roughly 27% of its electricity from solar (rooftop and utility combined), the highest share in the country.6 California sits at about 24%, with rooftop solar making up nearly half of that.
Lawrence Berkeley National Laboratory's 2024 "Tracking the Sun" report found that residential solar installations across the U.S. now total over 5 million homes, with median system sizes climbing from 5.6 kW in 2014 to 7.8 kW in 2023.7 Bigger systems mean homeowners are sizing for both today's bills and tomorrow's electric vehicles, heat pumps, and battery storage.
What this means if you live somewhere "low-ranked"
If your state is near the bottom of the list — say, West Virginia (3% wind+solar) or Mississippi (4%) — that doesn't mean rooftop solar is a bad bet. In fact, it can mean the opposite.
States with little renewable generation tend to lean heavily on coal and natural gas, which means:
- Higher and more volatile electric rates. Natural gas prices swung 200% during the 2022 winter spike, and those costs got passed straight to ratepayers.8
- More room for offset. If you're paying $0.18/kWh for coal-fired power, every kWh your roof produces saves you more money than the same kWh would in a state with cheap hydro.
- Untapped state-level incentives. Several lower-ranked states actually have generous rebates that go underused. South Carolina, for example, offers a 25% state tax credit on solar installations on top of any federal benefit.9
The math for a typical home
Let's run actual numbers. A 7 kW residential system in a state with average sun (say, Missouri at 4.5 peak sun hours/day) produces roughly:
7 kW × 4.5 hrs × 365 days × 0.80 (system losses) = 9,198 kWh/year
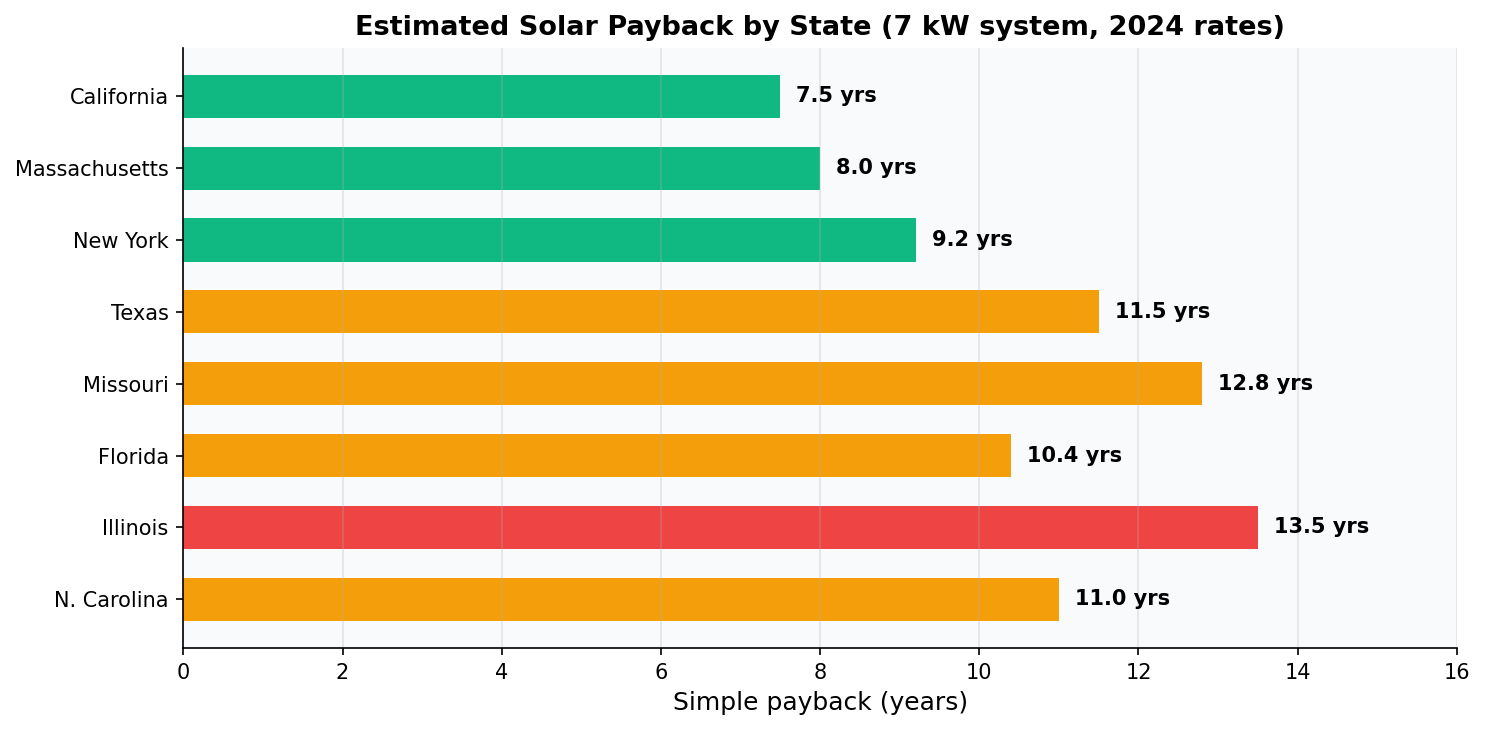
At Missouri's average residential rate of $0.13/kWh, that's $1,196/year off your electric bill. At a typical installed cost of $2.80/watt before incentives ($19,600 for a 7 kW system per EnergySage's 2024 marketplace data), simple payback is about 16.4 years.10
Add in your state's rebates and net-metering credits and that timeline often shrinks to 10–13 years — well within the 25-year warranty window of modern panels. The federal 30% Investment Tax Credit for purchased systems expired at the end of 2025, but homeowners who go with a lease or power purchase agreement (PPA) can still effectively capture the credit through their installer's tax equity, which is reflected in lower monthly payments.11
Battery storage changes the equation
Here's where the state ranking becomes really interesting. The same Plains states that lead on wind have some of the most volatile grid prices, because wind is intermittent. That's why utility-scale battery storage in states like Texas grew 60% year-over-year in 2024.12
For homeowners, a 10 kWh battery (like a Tesla Powerwall 3, Enphase IQ Battery 10, or FranklinWH aPower 2) paired with solar gives you:
- ~24 hours of backup for essential loads (refrigerator, lights, internet, a few outlets)
- Time-of-use arbitrage in states with TOU rates (charge cheap, discharge expensive)
- Eligibility for the residential battery 30% credit if installed standalone after 2025 (rules vary — check with a tax professional)
Several states layer additional battery rebates on top. California's SGIP program still offers up to $1,000/kWh for qualifying low-income or fire-risk households.13 Massachusetts' SMART program pays an ongoing performance incentive for solar+battery systems.
How to find your state's actual numbers
State rankings are useful context, but the only ranking that pays your bill is your own. Three things determine whether solar makes financial sense at your specific address:
- Your roof's solar resource (square footage, tilt, azimuth, shading) — pulled from NREL's PVWatts model
- Your utility's rate structure (flat, tiered, time-of-use, demand charges)
- Available state and local incentives (rebates, tax credits, net-metering rules, SREC markets)
EnergyScout's free solar assessment tool pulls all three together for any U.S. address in about 60 seconds. Type in your ZIP and average monthly bill, and it returns a system size estimate, annual production in kWh, and a payback range based on local rates.
The bottom line
Iowa, South Dakota, and Kansas didn't become wind-and-solar leaders by accident — they had the resource, the policy framework, and farmers who saw turbine lease payments as a steady second income.14 Most homeowners don't have 80 acres for a turbine, but the same logic scales down to a roof: produce your own power, lock in long-term costs, and stop paying for fuel-price volatility you can't control.
Whether your state is at the top or the bottom of the EIA's ranking, the question that actually matters is whether your specific roof, rate, and budget pencil out. That's a 60-second calculation, not a state-level debate.
Run your own numbers at energyscout.org/assessment, or browse local installers vetted by EnergyScout at energyscout.org/providers.
Sources
- Canary Media, "Which states get the most electricity from wind and solar power," May 2026
- U.S. Energy Information Administration, Electric Power Monthly, 2024 state generation data
- U.S. Department of Energy, WindExchange wind resource maps, 2023
- American Clean Power Association, U.S. Wind Industry Annual Market Report 2024
- EIA, Average Price of Electricity to Ultimate Customers by State, 2024
- SEIA, Solar Market Insight Report 2024 Year in Review
- Lawrence Berkeley National Laboratory, "Tracking the Sun" 2024 edition
- EIA, Henry Hub Natural Gas Spot Price historical data, 2022
- South Carolina Department of Revenue, Solar Energy Tax Credit (TC-38)
- EnergySage Solar Marketplace, 2024 Solar Pricing Report
- Internal Revenue Service, Inflation Reduction Act residential energy credit guidance, 2024–2026
- EIA, Battery Storage in the United States: An Update on Market Trends, 2024
- California Public Utilities Commission, Self-Generation Incentive Program (SGIP) handbook 2024
- USDA Economic Research Service, Wind Lease Payments to Farmers 2023
More Articles
Do Solar Panels Work During a Power Outage?
Most homeowners assume solar panels keep the lights on when the grid goes down. The actual answer surprises people — and the fix is simpler than you think.
Read article Battery StorageChile Hit 75% Solar in March. Here's What U.S. Homeowners Should Take From It
Chile's grid produced 29% of its electricity from solar in March, with peaks at 75%. The bottleneck wasn't generation — it was storage and transmission. Here's the homeowner takeaway.
Read article