Australia Hits 27% EV Sales: What It Means for US Homes
In April 2026, plug-in vehicles made up 27% of Australian car sales. The shift abroad is a useful preview for US homeowners weighing solar, batteries, and home EV charging.
In April 2026, Australians bought 25,087 plug-in vehicles out of 94,049 total new car sales — roughly 26.7% of the market, according to CleanTechnica's April 2026 Down Under update. Battery-electric vehicles accounted for 15,459 of those sales; plug-in hybrids made up 9,628.
That's a useful number to sit with for a moment. More than one in four new cars sold in Australia last month plugs in. The U.S. is not Australia, but the household electricity question is the same on both continents: once you add an EV to your driveway, your home's electricity demand changes — and so does the math on rooftop solar and battery storage.
This isn't an article about whether you should buy an EV. It's about what the numbers say if you're already thinking about one, or already own one, and you're wondering whether solar and a battery actually pencil out.
The load shift hiding in plain sight
The average U.S. home uses about 10,500 kWh of electricity per year, or roughly 877 kWh per month, according to the U.S. Energy Information Administration. The average passenger vehicle in the U.S. is driven about 13,500 miles per year, per the Federal Highway Administration.
An EV uses roughly 0.3 kWh per mile in real-world driving (some better, some worse). Multiply it out:
- 13,500 miles × 0.3 kWh/mile = 4,050 kWh per year for a single EV
That's about a 39% increase on top of the average home's existing electricity use. Two EVs in the driveway and you're effectively running a second house from the meter's perspective.
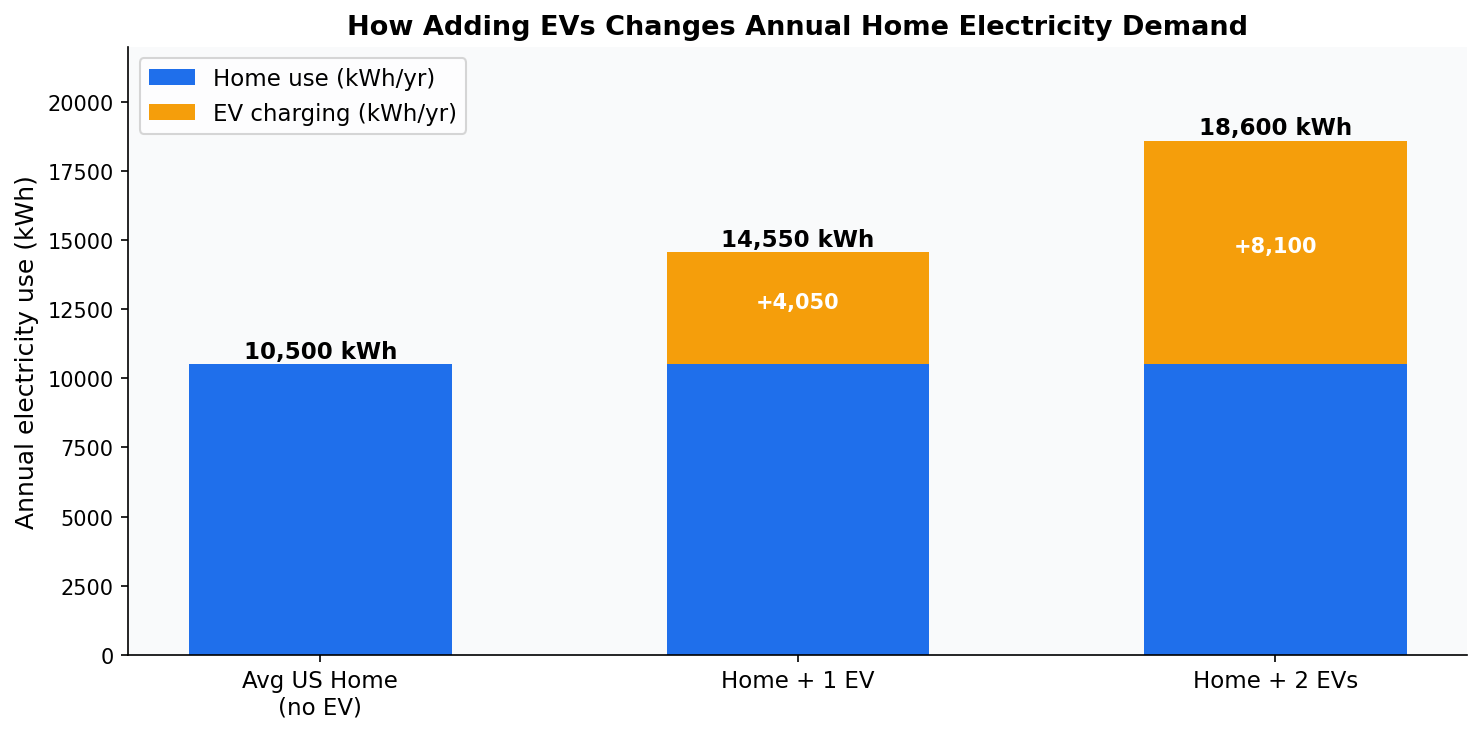
The Australian data matters here because Australia is a few years ahead of the U.S. on rooftop solar saturation — over 3.7 million Australian homes have solar, more than 30% of households. As EV adoption accelerated there, homeowners with solar started doing the math we're about to do.
The math: solar offset for an EV-charging home
Let's run the numbers for a typical mid-Atlantic or Sun Belt U.S. home with one EV. Assume:
- Annual home use: 10,500 kWh
- EV use: 4,050 kWh
- Total annual demand: 14,550 kWh
- Local electricity rate: $0.18/kWh (national average per EIA's Electric Power Monthly, residential)
- Annual electric bill without solar: ~$2,619
To offset 14,550 kWh in a region with ~1,400 kWh/kW of annual solar yield (a reasonable national midpoint per NREL's PVWatts), you'd need roughly:
- 14,550 ÷ 1,400 = ~10.4 kW system
At a national median installed cost of $2.80/W for residential solar (SEIA Q4 2025 market report), that's a gross system cost of about $29,000 before incentives.

The 2026 incentive reality
Here's where many older articles will steer you wrong: the federal 30% Investment Tax Credit for purchased residential solar expired at the end of 2025. Systems bought in cash or with a loan in 2026 no longer qualify for the federal credit. Only third-party-owned systems — leases and power purchase agreements (PPAs) — can still capture the commercial-side credit, and that benefit is typically passed through as a reduced monthly payment, not a tax refund to the homeowner.
State and utility incentives still matter and vary widely. New York's NY-Sun, California's SGIP for batteries, Massachusetts' SMART program, and dozens of state-level rebates and net-metering rules are still active — but the picture is now state-by-state, not federal.

If you want to know what's actually available where you live, the EnergyScout incentive search pulls together state, utility, and local programs by ZIP code. It's free and doesn't require an email.
Why batteries got more interesting in 2026
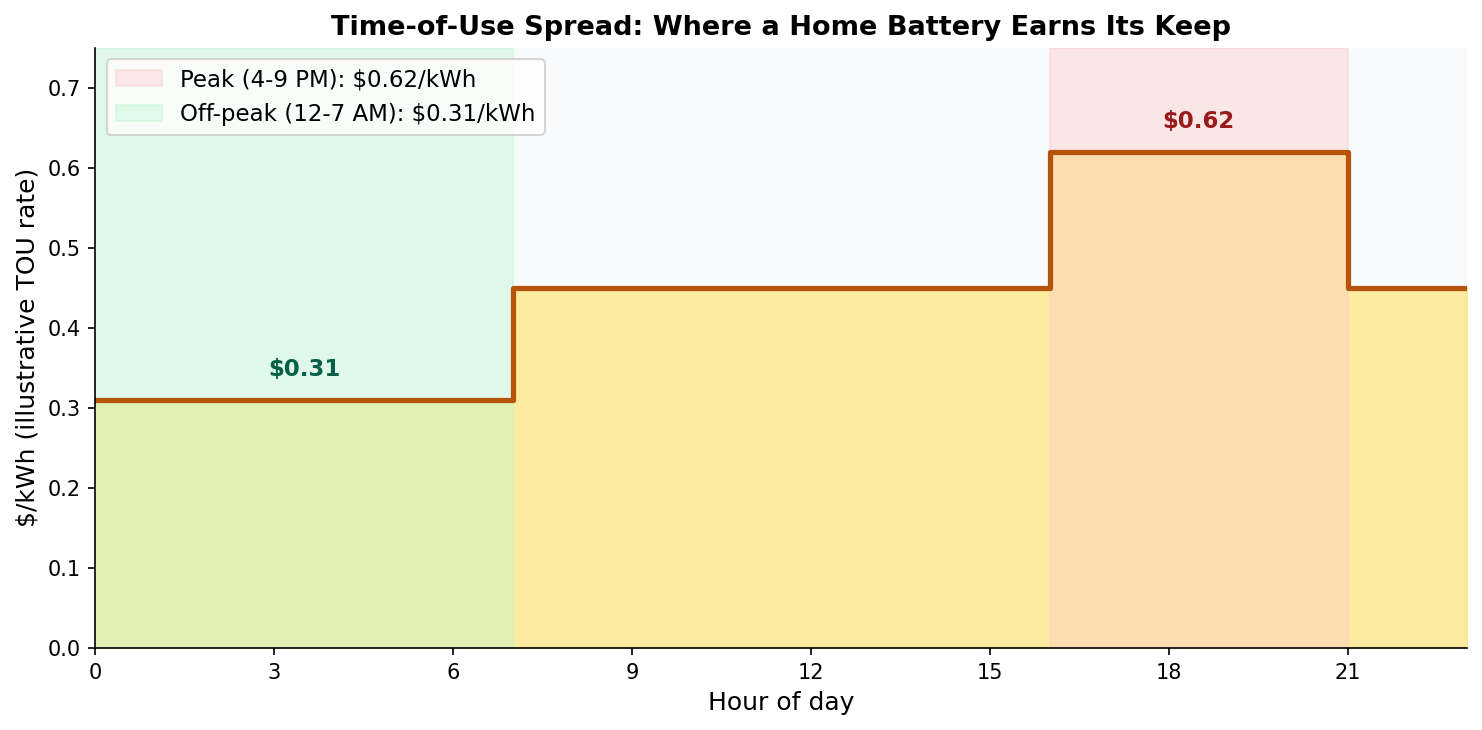
The Australian EV data points at something subtle but important: when a lot of homes in a region start charging EVs, the grid load curve changes. Utilities respond with time-of-use (TOU) pricing — cheaper electricity at midday when solar floods the grid, expensive electricity in the evening peak.
California already lives in this world. Under PG&E's EV2-A time-of-use rate, peak hours (4–9 p.m.) can hit $0.62/kWh while off-peak midnight charging drops to about $0.31/kWh. The spread is what makes a battery economically interesting.
The math on a battery is different from solar:
- Typical home battery: 10 kWh usable capacity (LFP chemistry)
- Cycle once per day shifting energy from $0.31 off-peak to $0.62 peak: $3.10/day arbitrage
- Annualized: ~$1,130/year in TOU savings, plus backup value during outages
According to Lawrence Berkeley National Lab's Tracking the Sun report, the median installed cost of paired solar + storage systems in 2024 was $4.20/W when including a battery. Storage-only retrofit installs ran a median of about $1,300 per kWh of capacity.
What the Australian curve tells us
Two things stand out in the Australian numbers worth borrowing for U.S. planning:
1. EV adoption rises faster than utility planners expect
Australia's plug-in share went from about 8% in 2022 to 27% in April 2026 — roughly tripling in three years (IEA Global EV Outlook 2024). Utilities tend to plan for linear growth and get caught flat-footed. Homeowners who already have rooftop solar and a battery are insulated from rate shocks driven by that growth.
2. Pairing matters more than either piece alone
Solar without a battery means you sell power to the grid at midday (often at low export rates) and buy it back at peak prices in the evening — exactly when you'd be charging an EV. A battery flips that economics. Australian solar-only homeowners are now widely retrofitting batteries for that reason.
The U.S. is heading toward the same structure. NEM 3.0 in California already cut solar export rates by about 75% (CPUC NEM 3.0 decision), and most other states with high solar penetration are tightening export rates too.
How to think about it for your own house
Three numbers do most of the work in deciding whether solar + battery makes sense for your situation:
- Your annual kWh use — pull a year of utility bills, sum the kWh column. Add ~4,000 kWh per EV in the household.
- Your blended electricity rate — total annual dollars paid divided by total annual kWh. If it's above $0.20/kWh, solar economics get attractive fast. Above $0.30/kWh, batteries do too.
- Your roof's solar potential — orientation, shading, and usable square footage. NREL's PVWatts gives free site-specific production estimates.
From there, the payback math is just arithmetic: system cost, minus incentives, divided by annual savings. National median payback for purchased residential solar in 2025 was 9–12 years (EnergySage 2025 marketplace report), with battery-only paybacks longer (10–15 years) outside of high-TOU markets.
Getting installer quotes worth comparing
One of the most common mistakes is comparing only price-per-watt across quotes. The right comparison is:
- Equipment quality (panel tier, inverter brand, battery chemistry)
- Production warranty (25 years on panels, 10+ on inverters)
- Workmanship warranty (the installer-specific guarantee — 10 years is decent, 25 is excellent)
- Permitting and interconnection track record (ask how many systems they've done in your utility territory)

If you want a starting point, the EnergyScout providers directory filters local installers by service area without requiring you to hand over your phone number first.
The bottom line
Australia's April 2026 numbers — 27% plug-in share, 15,459 BEVs sold in a single month — aren't a one-off. They're a preview of where U.S. household electricity demand is headed over the next five to ten years. Adding an EV roughly increases a home's electric load by 40%. That changes the payback math on rooftop solar, and it makes batteries materially more useful in TOU rate territories.
You don't have to act on any of this today. But if you've been putting off running the numbers because the federal ITC story changed, run them anyway — the state-level picture is still meaningful, and your blended rate plus your driving miles tell you almost everything you need to know.
If you want to skip the spreadsheet, you can run a free, no-email assessment at energyscout.org/assessment and pull your local incentives at energyscout.org/solar-battery-incentives-zipcode-search. Either way, the goal is the same: make the decision with real numbers, not a sales pitch.
More Articles
Do Solar Panels Work During a Power Outage?
Most homeowners assume solar panels keep the lights on when the grid goes down. The actual answer surprises people — and the fix is simpler than you think.
Read article Battery StorageChile Hit 75% Solar in March. Here's What U.S. Homeowners Should Take From It
Chile's grid produced 29% of its electricity from solar in March, with peaks at 75%. The bottleneck wasn't generation — it was storage and transmission. Here's the homeowner takeaway.
Read article