Bangladesh's Solar Boom: What 8.5 GW by 2035 Means for US Homeowners
GlobalData forecasts Bangladesh's solar capacity will more than sextuple to 8.5 GW by 2035. The shift from off-grid kits to grid-tied rooftops mirrors trends shaping US homeowner economics — and the ITC math that just changed.
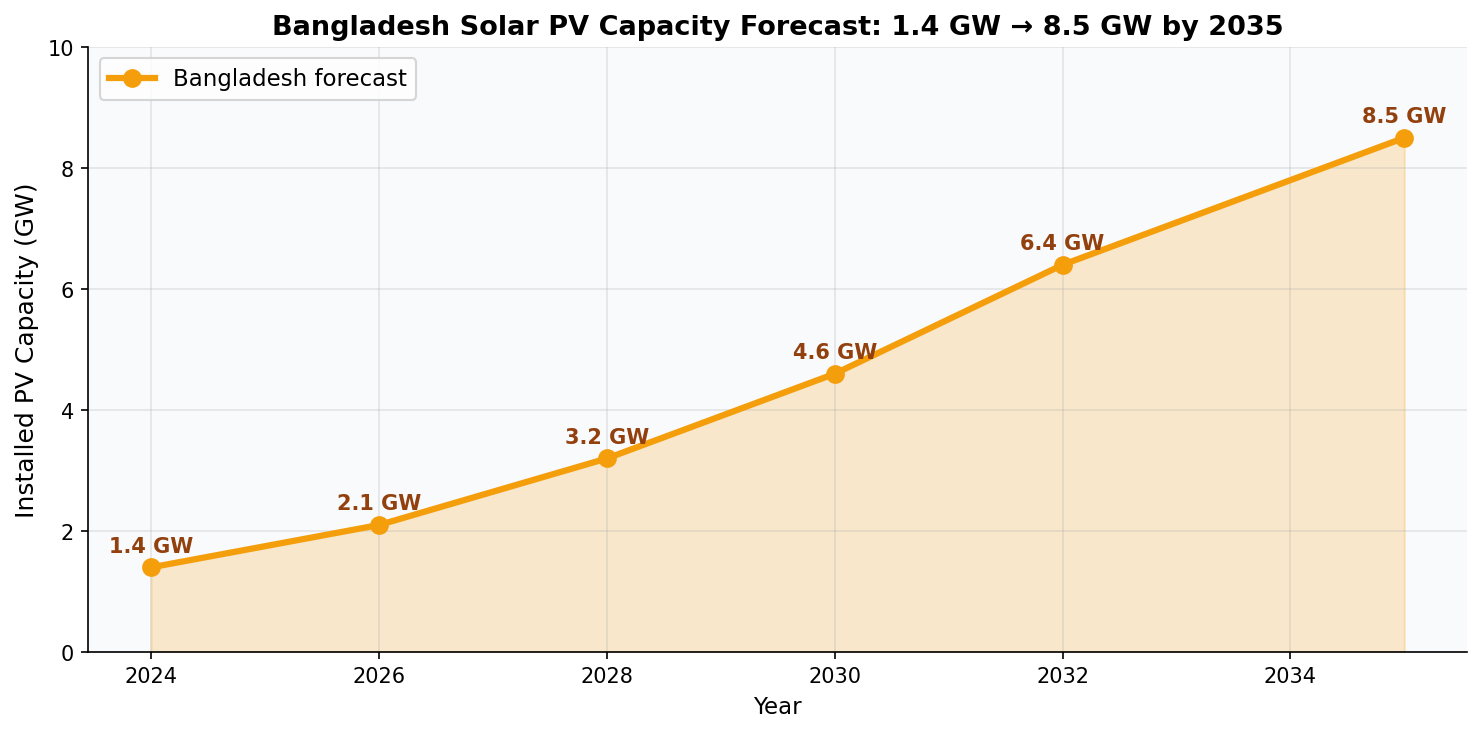
GlobalData published a forecast this week showing Bangladesh's installed solar PV capacity climbing from roughly 1.4 GW today to 8.5 GW by 2035 — a sixfold increase driven by a deliberate policy pivot from off-grid solar home systems toward grid-connected rooftop and utility-scale projects. PV Magazine covered the report on May 1.
It's tempting to scroll past international energy news. But what's happening in Dhaka is the same pattern reshaping rooftop economics in Phoenix, Pittsburgh, and Pasadena: panels are getting cheaper faster than batteries are getting better, grids are getting strained, and the financial case for generating your own electricity keeps tightening. Here's what the Bangladesh forecast tells us — and what it means if you're sizing a system for your own roof.
The Bangladesh numbers, in context
Bangladesh's grid-connected solar share was negligible a decade ago. According to IEA country data, the country built one of the world's largest off-grid solar home system markets — over 4 million units installed — to serve rural villages without grid access. That model is now being phased out as the national grid extends, and policy is shifting to net-metered rooftop systems and utility-scale plants.
The GlobalData forecast assumes:
- Rooftop solar growing from under 200 MW to roughly 2 GW by 2035
- Utility-scale projects providing the majority of new capacity
- Continued government feed-in tariffs and net metering at the distribution level
That trajectory — small, fragmented residential installs evolving into a mature net-metered market — is the same arc the US went through between roughly 2008 and 2020. The Solar Energy Industries Association (SEIA) tracked US residential solar from under 100,000 systems in 2010 to over 4 million by the end of 2024.
Why a Bangladesh forecast matters for a homeowner in Ohio
Three reasons.
1. Module prices are set globally, not locally
When a market like Bangladesh, India, or Vietnam scales up rooftop demand, it pulls module manufacturing volume forward. The NREL US Solar Photovoltaic System Cost Benchmark (Q1 2024) reported residential module prices around $0.31/W — down from over $2/W in 2010. Global demand keeps that curve bending. Lawrence Berkeley Lab's Tracking the Sun 2024 report shows median installed residential prices at roughly $4.10/W (pre-incentive) — and module costs are now a smaller share of the total than soft costs (permitting, labor, customer acquisition).
Translation: hardware is cheap and getting cheaper. Where you can move the needle on your own quote is on the soft-cost side — which means getting multiple installer bids.
2. Grid-tied rooftop is a global standard now
Bangladesh skipping straight from off-grid to net-metered grid-tied is the same architectural choice that made US rooftop solar work. Net metering — where excess generation spins your meter backward and you get credited at retail rates — is what turns a 7 kW array into a $1,500/year savings machine instead of a science project.
That model is under pressure. California's CPUC NEM 3.0 decision cut export credit values by roughly 75% for new interconnections starting April 2023, pushing the state toward solar + battery economics. Other states (NY, MA, AZ) are reviewing similar successor tariffs. The lesson from Bangladesh's planned rollout — and from California's NEM 3.0 — is the same: self-consumption is becoming more valuable than export. Battery storage is increasingly part of the optimal system, not a luxury add-on.

3. The ITC math just changed (and most homeowners haven't caught up)
One of the biggest US-specific shifts homeowners need to understand: the federal 30% Residential Clean Energy Credit (Section 25D) for purchased solar systems expired at the end of 2025. That's based on the legislative language passed in 2025. For systems placed in service in 2026 and beyond, a homeowner who buys the system outright no longer claims the 30% federal tax credit.
What still qualifies: third-party-owned systems — leases and power-purchase agreements (PPAs) — where the installer/financier owns the system and claims the commercial Investment Tax Credit (Section 48E). Those savings can be passed through to you in the form of lower monthly payments.
This single change rewrites the comparison spreadsheet for every quote you'll get this year:
- Cash purchase: no federal credit. Payback math depends entirely on local utility rates, state rebates, and SREC markets.
- Loan: same as cash — no ITC for the homeowner.
- Lease / PPA: installer claims the commercial ITC and (in theory) prices the contract accordingly. You should ask to see how the credit flows into the rate you're being offered.
State-level incentives — SGIP in California, SMART in Massachusetts, NY-Sun in New York, the federal residential battery storage rules under separate statute — are now doing more of the work. Run your ZIP through our incentives database before you sign anything.
The math homeowners should actually run
Forget global forecasts for a minute. Here's the calculation that matters on your roof.
A typical US single-family home uses about 10,800 kWh/year per the EIA. To offset that with solar, in a region averaging 4.5 peak sun-hours, you need a system around 7 kW DC.
Cost it out:
- 7 kW × $4.10/W (LBNL median) = $28,700 installed, before any state/local credits
- Production: 7 kW × 4.5 hr × 365 × 0.78 derate ≈ 8,970 kWh/year
- At a national average residential rate of $0.169/kWh (EIA Electric Power Monthly, early 2025), that's $1,516/year in offset bills
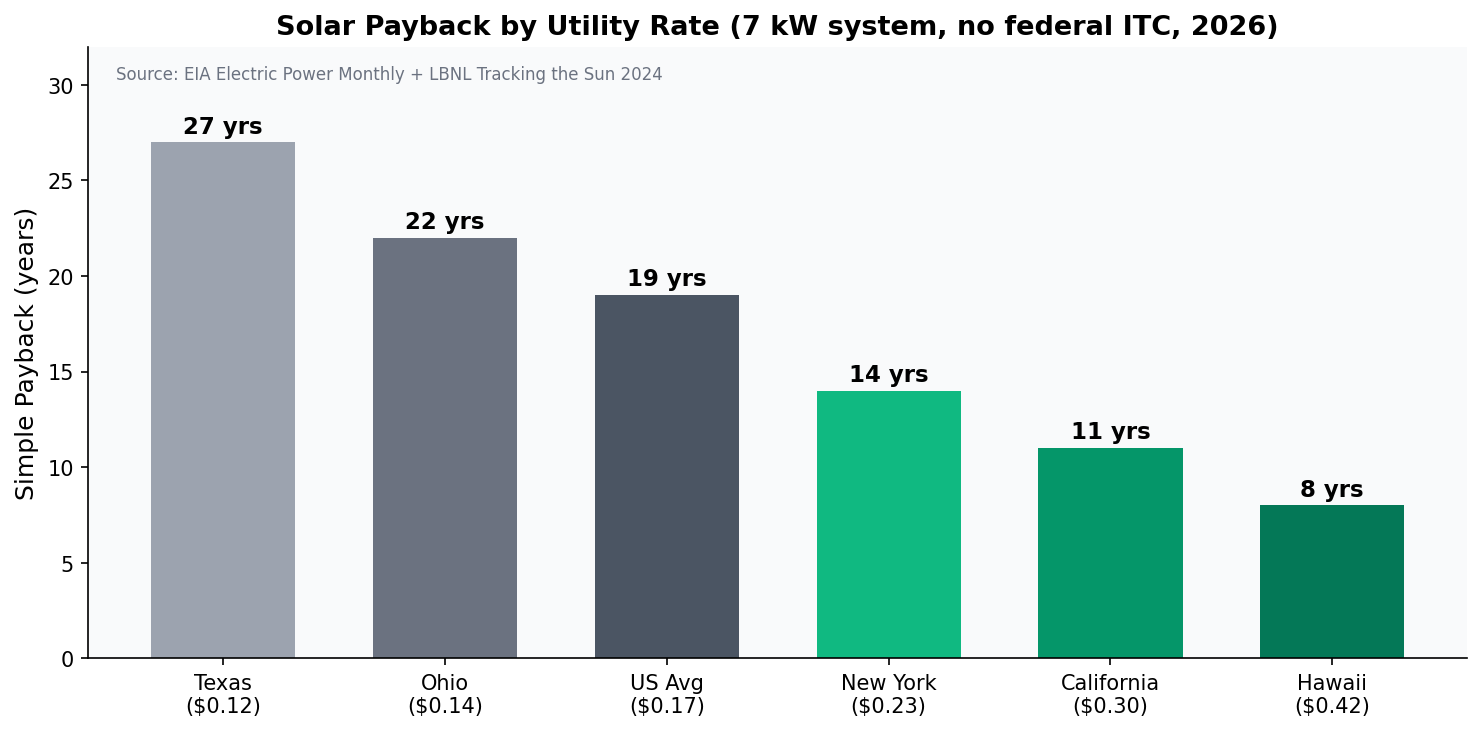
- Simple payback (no ITC, no state incentive): ~19 years
- With a $3,000 state incentive + favorable net metering: ~17 years
- If you're in a high-rate state ($0.30+/kWh — CA, MA, HI, NY): payback drops under 12 years even without the federal credit
That's why, post-ITC, your local utility rate is the single biggest variable in whether solar makes sense for you. Bangladesh's economics work because grid power is expensive and unreliable; California's still work because PG&E and SCE rates are among the highest in the country. Texas rates near $0.12/kWh make the math harder.
Battery storage: the part nobody talks about until they need it
Bangladesh's grid sees frequent outages. So does Houston, increasingly. So do California's PSPS zones. The DOE and Lawrence Berkeley Lab have both published recent work on residential storage economics. The summary: under NEM 3.0-style tariffs, a paired battery typically improves system economics, not just resilience.
Sizing matters. A 10 kWh battery covers roughly:
- ~30 hours of essentials (fridge, lights, internet, phone charging, a few outlets)
- ~8–12 hours of normal household load
- ~4–6 hours if you're trying to run AC
Battery prices have fallen but not at module pace. Expect $1,000–$1,400 per usable kWh installed for popular brands (Tesla Powerwall 3, Enphase IQ, Franklin aPower) in 2025–2026.

What to take away from the Bangladesh report
- Global demand keeps modules cheap. Hardware isn't the cost driver anymore — soft costs are. Get three quotes.
- Net metering is the foundation, but it's eroding. Self-consumption + storage is the durable model. Plan for that, not for a 1:1 export credit that may not exist in 5 years.
- The federal 30% ITC for purchased systems is gone. Recheck your payback math. Leases/PPAs still capture the commercial credit on your behalf.
- State and local incentives matter more than ever. Two homes 30 minutes apart can have wildly different ROI based on utility tariff and state rebate.
- Your utility rate is the dominant variable. Pull a year of bills and calculate your actual blended rate before any installer tells you what you'll save.
Run your own numbers
The reason GlobalData can forecast 8.5 GW for Bangladesh is because the per-kilowatt math has gotten boring and predictable: solar works, batteries fill in the gaps, and every market eventually moves in this direction. The interesting question isn't whether solar pencils out — it's how it pencils out for your specific roof, utility, and household.
Start with a free production estimate using NREL irradiance data and your actual ZIP at energyscout.org/assessment. Compare local installer pricing through our vetted provider directory. Check what your state and utility currently pay (and clawback) at our incentives ZIP lookup.
The global numbers are interesting. The numbers on your own roof are what actually pay your bill.
More Articles
Do Solar Panels Work During a Power Outage?
Most homeowners assume solar panels keep the lights on when the grid goes down. The actual answer surprises people — and the fix is simpler than you think.
Read article Battery StorageChile Hit 75% Solar in March. Here's What U.S. Homeowners Should Take From It
Chile's grid produced 29% of its electricity from solar in March, with peaks at 75%. The bottleneck wasn't generation — it was storage and transmission. Here's the homeowner takeaway.
Read article