Data Centers Are Reshaping the Grid. Here's What It Means for Your Power Bill.
Data center demand could push U.S. electricity load up 16% by 2029, and utilities are passing infrastructure costs to homeowners. Here's how rooftop solar and battery storage offer a real hedge — with the math.
The headline from a recent Renewable Energy World piece on data center backlash captures something most homeowners are starting to feel in their utility bills: the grid is being asked to carry more load than it was built for, and somebody has to pay for the upgrades. The question is who.
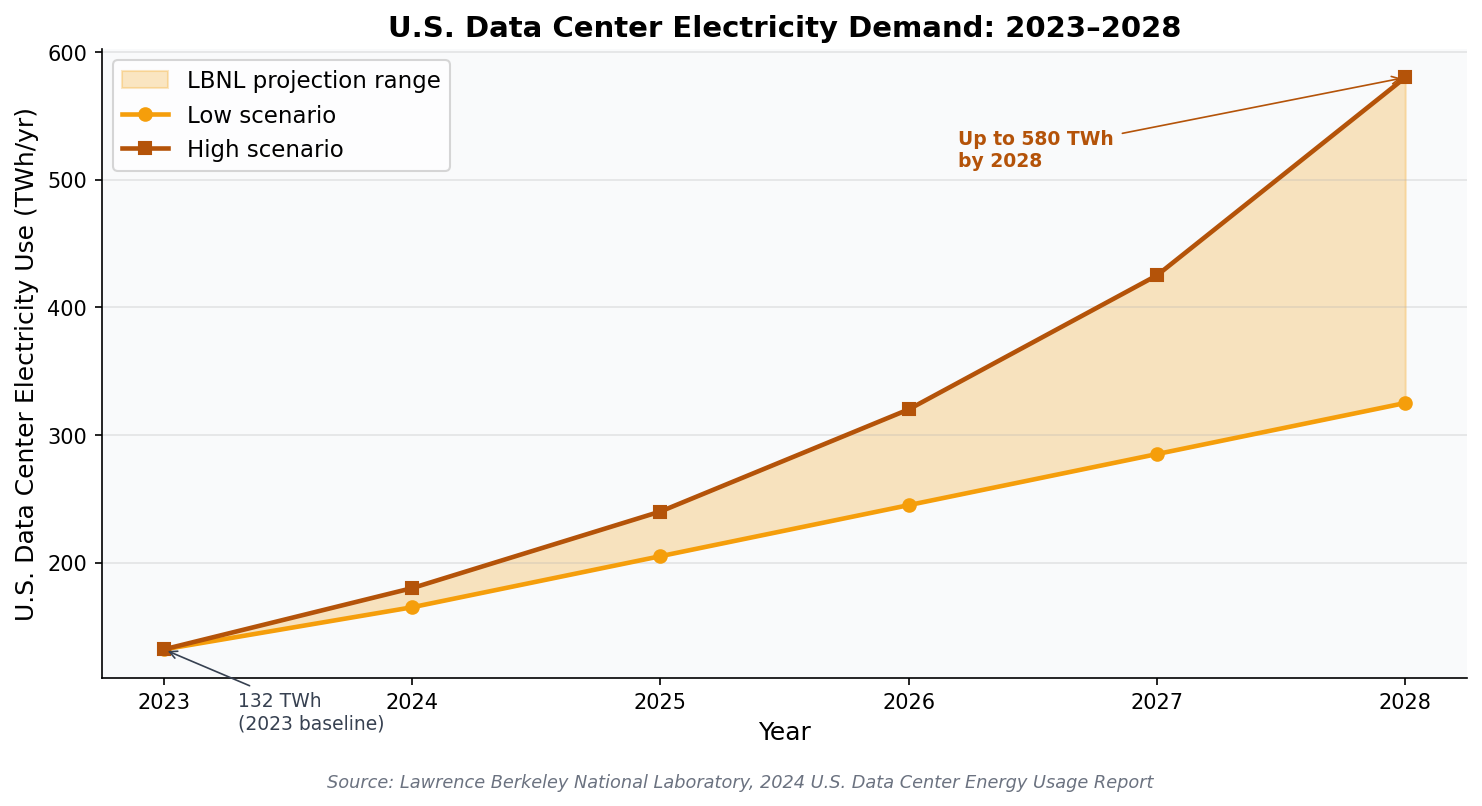
According to the Electric Power Research Institute (EPRI), data centers could consume up to 9% of all U.S. electricity by 2030 — more than double their 2023 share (EPRI, 2024). The Lawrence Berkeley National Laboratory's 2024 U.S. Data Center Energy Usage Report puts data center load growth at 132 TWh in 2023, climbing to between 325 and 580 TWh by 2028 (LBNL, 2024).
That's a lot of new demand showing up in regions where the wires, substations, and generation capacity weren't planned for it. And under standard utility ratemaking, the cost of building that infrastructure gets spread across the rate base — including residential customers.
Why this matters at the kitchen table
The U.S. Energy Information Administration tracks average residential electricity prices monthly. The national average rose from 13.72¢/kWh in January 2022 to 16.26¢/kWh by mid-2024 — an 18.5% increase in roughly two years (EIA Electric Power Monthly). In states with concentrated data center growth — Virginia, Texas, Arizona, Georgia — the trajectory is steeper.
Virginia's Dominion Energy, which serves "Data Center Alley" in Loudoun County, projected in its 2024 Integrated Resource Plan that load will double over the next 15 years, driven primarily by data center growth (Dominion 2024 IRP). The utility has already filed for rate increases tied to grid expansion. Residential customers will see those costs.
The math on a typical home
Let's run a concrete scenario. A household using 900 kWh per month at 16.26¢/kWh pays roughly $146/month, or $1,756/year, before fees and demand charges. If residential rates climb another 4% per year through 2030 — a conservative pace given current trajectories — that same household pays about $2,150/year by 2030. Over 25 years (the warranted lifespan of most solar panels) at compounding 3% rate inflation, lifetime grid cost lands around $64,000.
That's the number to anchor on. Every conversation about solar economics has to start with what you'd otherwise pay the utility.

What rooftop solar actually does in this market
Rooftop solar is, at its core, a hedge against utility rate inflation. You pay the cost of the system upfront (or finance it), and in exchange, you lock in a known cost-per-kWh for the life of the panels. The National Renewable Energy Laboratory's PVWatts model — the same engine EnergyScout uses for production estimates — pegs a 7 kW system in a sunny climate at roughly 10,500–12,000 kWh per year (NREL PVWatts).
At today's installed cost of about $2.85/watt before incentives (EnergySage Marketplace Report 2024), a 7 kW system costs around $20,000 cash. State-level rebates and net metering vary widely, which is why the zip-code-level math matters more than national averages.
The federal incentive picture in 2026
One important update: the federal 30% Investment Tax Credit for purchased residential solar systems expired at the end of 2025 under the One Big Beautiful Bill Act. Leases and PPAs (third-party-owned systems) can still claim the credit through their financing partners, which is reshaping how households evaluate ownership versus financing (SEIA, 2026).
That doesn't kill the economics — state incentives, net metering credits, and the underlying utility-bill offset still drive most of the value — but it does change the payback math meaningfully. We strongly recommend running your own numbers rather than relying on industry averages.

Where battery storage enters the picture
Data center growth doesn't just push rates up — it also changes when the grid is stressed. Utilities are increasingly moving residential customers to time-of-use (TOU) rates, where electricity costs more in the late afternoon and evening. California's IOUs already do this, with peak rates exceeding 50¢/kWh on some plans (CPUC).
Battery storage lets you store midday solar production and discharge it during peak rate hours. A 10 kWh battery (think Tesla Powerwall, Enphase IQ Battery, or FranklinWH) shifting 8 kWh per day from $0.18/kWh midday to $0.45/kWh peak generates about $2.16/day, or $789/year in arbitrage value — on top of solar's direct offset.
Batteries also provide backup power. Lawrence Berkeley Lab's 2024 power outage research documented an average of 5.5 hours of annual outage time per U.S. customer, with significant regional variability (LBNL Energy Markets & Policy). For households on medical equipment, working from home, or in storm-prone regions, that resilience has real value beyond pure economics.
What homeowners should actually do
Three practical steps, in order of cost (zero, low, higher):
- Read your utility bill carefully. Note your average rate, any TOU schedule, and whether your utility has filed for rate increases tied to capacity expansion. Most state public utility commission websites publish active rate cases.
- Check what incentives apply at your zip code. State, utility, and municipal incentives vary enormously. The Database of State Incentives for Renewables & Efficiency (DSIRE) is the authoritative public source. EnergyScout's incentives search tool aggregates these into a single view by zip code.
- Get real production estimates and quotes for your roof. NREL's PVWatts gives a strong baseline. Local installers translate that into actual proposals. Get more than one quote — EnergySage data shows installer pricing varies by 20–40% in the same metro area.

The bigger picture
The Renewable Energy World piece argues that data center development can become a catalyst for grid modernization rather than a source of community backlash — but only with proactive strategy. From a homeowner's perspective, that strategy plays out in two ways simultaneously: utilities upgrading transmission and generation, and individual households reducing their exposure to whatever rate increases come from those upgrades.
Distributed solar and storage aren't a replacement for grid investment. They're a hedge — a way for individual households to insulate themselves from the worst of the rate inflation that often follows large infrastructure buildouts. The Department of Energy's Solar Futures Study modeled scenarios where distributed solar provides 30% of U.S. residential electricity by 2035, complementing utility-scale capacity (DOE Solar Futures Study).
For homeowners, the calculus is straightforward: the more your utility's costs are likely to rise, the more valuable a fixed-cost generation asset on your roof becomes. The opposite is also true — in regions with stable, low rates and minimal data center load growth, rooftop solar may pay back more slowly. Run your own numbers.
The bottom line
Data centers aren't going away, and the grid investment to support them is going to be paid for somehow. Households that understand their local rate trajectory, available incentives, and realistic production for their roof are in the strongest position — whether they decide to install solar, install solar plus storage, or simply shift their consumption patterns.
If you want to see what the math looks like for your specific home and zip code, EnergyScout's free assessment tool uses NREL data to estimate production, layers in your local incentives, and gives you a realistic payback estimate before you talk to a single installer. No sign-up wall, no lead-selling — just the numbers.
Visit energyscout.org to run yours.
More Articles
Do Solar Panels Work During a Power Outage?
Most homeowners assume solar panels keep the lights on when the grid goes down. The actual answer surprises people — and the fix is simpler than you think.
Read article Battery StorageChile Hit 75% Solar in March. Here's What U.S. Homeowners Should Take From It
Chile's grid produced 29% of its electricity from solar in March, with peaks at 75%. The bottleneck wasn't generation — it was storage and transmission. Here's the homeowner takeaway.
Read article