Scope 3 Emissions: How Home Solar Cuts the Hardest Carbon
Scope 3 emissions — the indirect carbon hiding in supply chains and electricity use — are the hardest to reduce. Home solar and batteries are one of the few tools that actually move the needle for households and the businesses that serve them.
A new piece in CleanTechnica (May 1, 2026) makes a point that's worth sitting with: even with federal climate language scrubbed from US policy documents, corporations are still quietly working on emissions mitigation — because the math hasn't changed. The hardest part of that math is Scope 3: the indirect emissions that sit upstream and downstream of a company's own operations. For most large firms, Scope 3 is 70–90% of their total carbon footprint, according to the Greenhouse Gas Protocol.
What does this have to do with your roof? More than you'd think. The electricity you buy from your utility is somebody else's Scope 3. The natural gas your appliance manufacturer used to make your water heater is somebody else's Scope 3. And one of the few tools available to households that meaningfully reduces both your own footprint and the upstream Scope 3 burden of the businesses you buy from is on-site solar generation paired with battery storage.
Let's run the actual numbers.
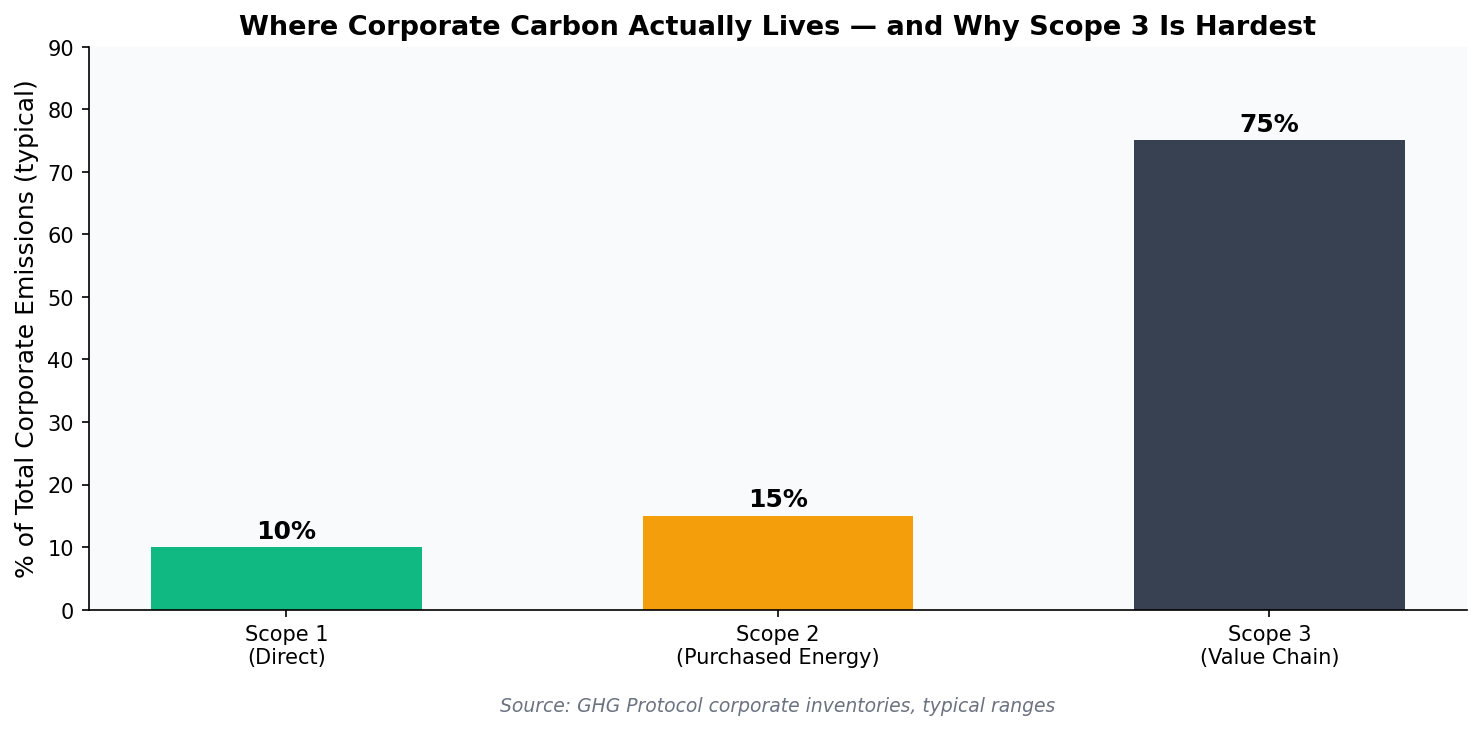
What Scope 1, 2, and 3 actually mean
The Greenhouse Gas Protocol splits emissions into three buckets:
- Scope 1: Direct emissions from sources you own — a furnace, a fleet vehicle, a gas stove.
- Scope 2: Indirect emissions from purchased electricity, steam, or heat.
- Scope 3: Everything else in the value chain — supply chain, employee commuting, product use, end-of-life disposal.
For a homeowner, the rough analogues are: gas appliances and your car (Scope 1), the electricity bill (Scope 2), and the embedded carbon in the food, clothing, and goods you buy (Scope 3). The US Energy Information Administration reports that the average kWh on the US grid produces about 0.85 lbs of CO₂. Multiply by a typical 10,800 kWh/year of US household electricity use (EIA, 2023) and you're looking at roughly 4.6 metric tons of CO₂ per year from electricity alone.
Why Scope 3 is the hardest to cut
If you're a Fortune 500 company, you can sign a power purchase agreement and decarbonize Scope 2 in a year. You can electrify your fleet and chip away at Scope 1. But Scope 3 — the emissions baked into your suppliers, your products in customer hands, the daily commute of your workforce — those require thousands of decisions you don't control.
This is exactly where distributed residential energy comes in. When a homeowner installs solar, three things happen at once:
- The household's own Scope 2 footprint drops.
- The utility serving them sells less fossil-generated power, lowering its Scope 1.
- Every business that touches that customer — from grocery stores to streaming services — sees a marginal reduction in the embedded electricity emissions of serving them, which flows through as Scope 3 reductions.
It's a quiet kind of leverage, but at scale it's significant. NREL's 2021 Solar Futures Study projects that decarbonizing the US grid by 2035 — a path heavily reliant on distributed solar — would cumulatively avoid up to 130 gigatons of CO₂ by 2050.

The math for one household
Take a 7 kW rooftop system in a moderate-sun region (say, Indianapolis or Raleigh). Using NREL's PVWatts defaults, that system produces roughly 9,500 kWh/year. At the EIA's average grid emissions factor:
- 9,500 kWh × 0.85 lb CO₂/kWh = 8,075 lbs CO₂ avoided per year
- That's about 3.66 metric tons annually
- Over a 25-year system life: roughly 91 metric tons of CO₂
For comparison, the EPA's equivalencies calculator says 91 metric tons is roughly the lifetime emissions of 22 gasoline cars driven for a year, or the carbon sequestered by 1,500 mature trees over a decade.
The financial side: what's actually changed in 2026
Here's the part most articles get wrong: the federal 30% Investment Tax Credit (ITC) for purchased residential solar systems expired at the end of 2025. As of 2026, only third-party-owned systems — leases and Power Purchase Agreements (PPAs) — can still claim the credit, which is monetized by the lessor and typically passed through as lower monthly payments.
This changes the cost calculus, but not the climate calculus. State and utility incentives are still very much alive. DSIRE tracks more than 2,400 active state and local programs as of early 2026. Examples that are still on the books:
- California SGIP: Up to $1,000/kWh for battery storage in equity-eligible zip codes (CPUC).
- New York NY-Sun: Block-grant incentives that reduce installed cost by $0.20–$0.40/W depending on region.
- Massachusetts SMART: Performance-based payments for solar production over 10 years.
- Property tax exemptions in 36 states (per SEIA's 2025 state-by-state tracker).
You can check what's available in your zip code with EnergyScout's incentive search tool.

Where batteries fit into the Scope 3 story
A battery doesn't generate clean power, but it shifts when you use it. That matters because grid emissions vary throughout the day. Lawrence Berkeley National Laboratory's Locational Marginal Emissions framework shows that the marginal kWh on the grid in the evening — when most homes are pulling from natural gas peakers — is often 30–50% dirtier than the daytime average.
A 10 kWh battery charged from rooftop solar at noon and discharged at 7 PM is displacing some of the dirtiest electrons of the day. Per the LBL 2024 utility-scale solar report, this time-shifted clean generation is increasingly being valued by utilities through Time-of-Use rates and capacity payments.
The math for batteries is more sensitive to local rate structures than solar alone. In California, with TOU peak rates above $0.55/kWh and off-peak below $0.20/kWh, a battery cycling daily can save $400–$700/year. In a flat-rate state like Indiana, the financial case for batteries leans more on backup value and resilience than on rate arbitrage.
For homeowners who don't want to do the math themselves
Three numbers tell you most of what you need to know before getting a quote:
- Your annual kWh use: On your utility bill, or the average of 12 months.
- Your blended electricity rate: Total bill ÷ kWh used. The national average is $0.166/kWh per EIA's February 2026 data, but ranges from $0.11 (Idaho) to $0.42 (Hawaii).
- Your roof's southern exposure and shading: Walk outside at noon and look up.
Plug those into EnergyScout's free assessment tool and you'll get a NREL-modeled production estimate, payback range, and a list of vetted local installers in your area. No phone calls, no high-pressure sales — just numbers.

The bigger picture
Scope 3 emissions are corporate jargon for a homeowner-shaped problem: most carbon is hidden upstream and downstream of where any single decision-maker has authority. The handful of decisions households actually control — what kind of car, what kind of heat, what kind of electrons — are disproportionately powerful precisely because they aren't anybody's Scope 1 or Scope 2.
Rooftop solar is one of the cleanest, longest-lived, most-financeable household decisions available. Even without the federal ITC for purchased systems, the underlying economics in most US zip codes still pencil out within 8–12 years, and the climate math doesn't expire.
If you want to see what the numbers look like for your specific roof, address, and utility, run the assessment at energyscout.org. It's free, it's NREL-modeled, and it will tell you what the math actually is — not what an installer with a quota wants you to believe.
Sources: CleanTechnica (May 2026), Greenhouse Gas Protocol, US EIA, NREL Solar Futures Study, Lawrence Berkeley National Laboratory, EPA, DSIRE, CPUC, SEIA.
More Articles
Do Solar Panels Work During a Power Outage?
Most homeowners assume solar panels keep the lights on when the grid goes down. The actual answer surprises people — and the fix is simpler than you think.
Read article Battery StorageChile Hit 75% Solar in March. Here's What U.S. Homeowners Should Take From It
Chile's grid produced 29% of its electricity from solar in March, with peaks at 75%. The bottleneck wasn't generation — it was storage and transmission. Here's the homeowner takeaway.
Read article