Korea's Submarine Solar Cable: What It Means for US Homes
South Korea just contracted Taihan Cable to lay 154 kV submarine cables connecting island and floating solar arrays to the mainland grid. The project highlights a global trend US homeowners can use to their advantage.
On May 1, 2026, PV Magazine reported that South Korea's Taihan Cable & Solution secured its first fully integrated contract to supply and install 154 kV submarine cables linking island-based and floating photovoltaic arrays to the mainland grid (PV Magazine, May 2026). It's a small story with a big lesson for US homeowners: utilities everywhere are spending heavily to move solar electricity from where it's generated to where it's consumed — and that bill is showing up on your monthly statement.
If you've watched your electricity rate climb 5% to 8% a year and wondered why, transmission and distribution upgrades are a major reason. Understanding that trend is the first step to deciding whether rooftop solar plus a battery makes sense for your home.
The Korean project, by the numbers
The Taihan contract covers 154 kV (kilovolt) submarine cables — high-voltage AC lines designed to move utility-scale solar power across seabed routes. South Korea has been pushing offshore and floating PV aggressively because flat, sunny land is scarce on the peninsula. According to the International Energy Agency, South Korea added roughly 4.5 GW of new solar capacity in 2024, with floating solar making up an increasing share (IEA Renewables 2024).
Submarine power cables aren't cheap. Industry pricing data from Wood Mackenzie puts installed costs for HVAC submarine cables at roughly $2 million to $4 million per kilometer, depending on water depth and seabed conditions. Multiply that by tens of kilometers and you're looking at hundreds of millions of dollars of grid spend — for a single project.
Why this matters to a homeowner in Phoenix or Pittsburgh
South Korea is not unique. Every major grid in the world is facing the same problem: the cheapest new electricity is solar and wind, but those resources are often far from where the demand is. Closing that gap costs money, and that money flows through your utility bill.
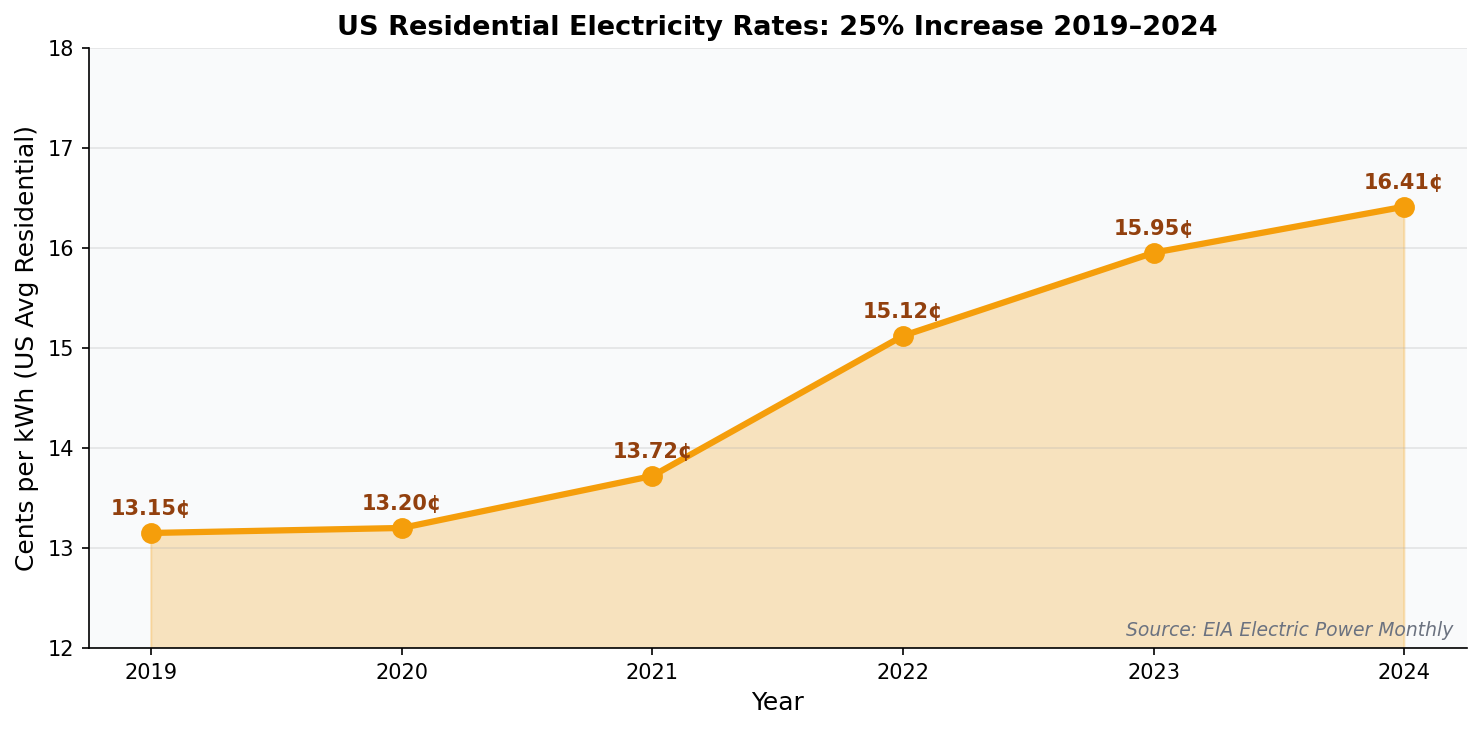
The US Energy Information Administration tracks electricity prices monthly. The average residential rate hit 16.41 cents/kWh in 2024 — up from 13.15 cents/kWh in 2019, a 25% increase in five years (EIA Electric Power Monthly). Lawrence Berkeley National Laboratory's 2024 Utility-Scale Solar report found that more than half of the cost of delivered electricity in many US markets is now transmission and distribution, not generation (LBNL Utility-Scale Solar 2024).
Translation: even if generation gets cheaper (and it has — Lazard's 2024 LCOE report puts unsubsidized utility solar at $29 to $38/MWh), the bill keeps rising because the wires keep getting more expensive.
The math on rooftop solar in 2026
Rooftop solar sidesteps most of the transmission cost stack. When your panels feed your refrigerator, the electricity travels twenty feet, not two hundred miles. Here's what a typical 7 kW residential system looks like in real numbers.
Using NREL's PVWatts calculator with default loss assumptions, a 7 kW south-facing system in:
- Phoenix, AZ produces about 11,800 kWh/year. At Arizona's average residential rate of 14.5 cents/kWh, that's roughly $1,711/year in offset bills.
- Atlanta, GA produces about 10,200 kWh/year. At 14.0 cents/kWh, that's roughly $1,428/year.
- Boston, MA produces about 9,100 kWh/year. At 30.8 cents/kWh, that's roughly $2,803/year.
(Production figures via NREL PVWatts; rate data via EIA.)
EnergySage's 2024 Solar Marketplace Report puts the national average installed cost of residential solar at $2.85/watt before incentives, so a 7 kW system runs about $19,950 gross (EnergySage 2024).

The 2026 incentive picture — what changed
This is the part most homeowners get wrong, so read carefully.
The federal 30% Residential Clean Energy Credit (Section 25D) — the credit that let homeowners deduct 30% of a purchased solar system from their federal taxes — expired for purchased systems at the end of 2025. If you buy panels in 2026, you do not get the 30% federal tax credit on your personal return.
However, the commercial Investment Tax Credit (Section 48) remains available for systems owned by third parties. That means if you sign a solar lease or Power Purchase Agreement (PPA), the installer or financier still claims the 30% ITC, and that savings is typically passed through to you in the form of a lower monthly payment.
State and utility incentives are unchanged in most markets. SEIA tracks active programs at the state level — net metering, state income tax credits, sales tax exemptions, property tax abatements, and SREC markets in states like New Jersey, Massachusetts, and Maryland (SEIA).
For battery storage, California's Self-Generation Incentive Program (SGIP) still offers rebates between $150/kWh and $1,000/kWh depending on income tier and equity classification (CPUC SGIP). The new federal Section 25D credit no longer applies to standalone storage purchased in 2026, but utility-level rebates and state credits remain in many markets.

Payback math, post-ITC
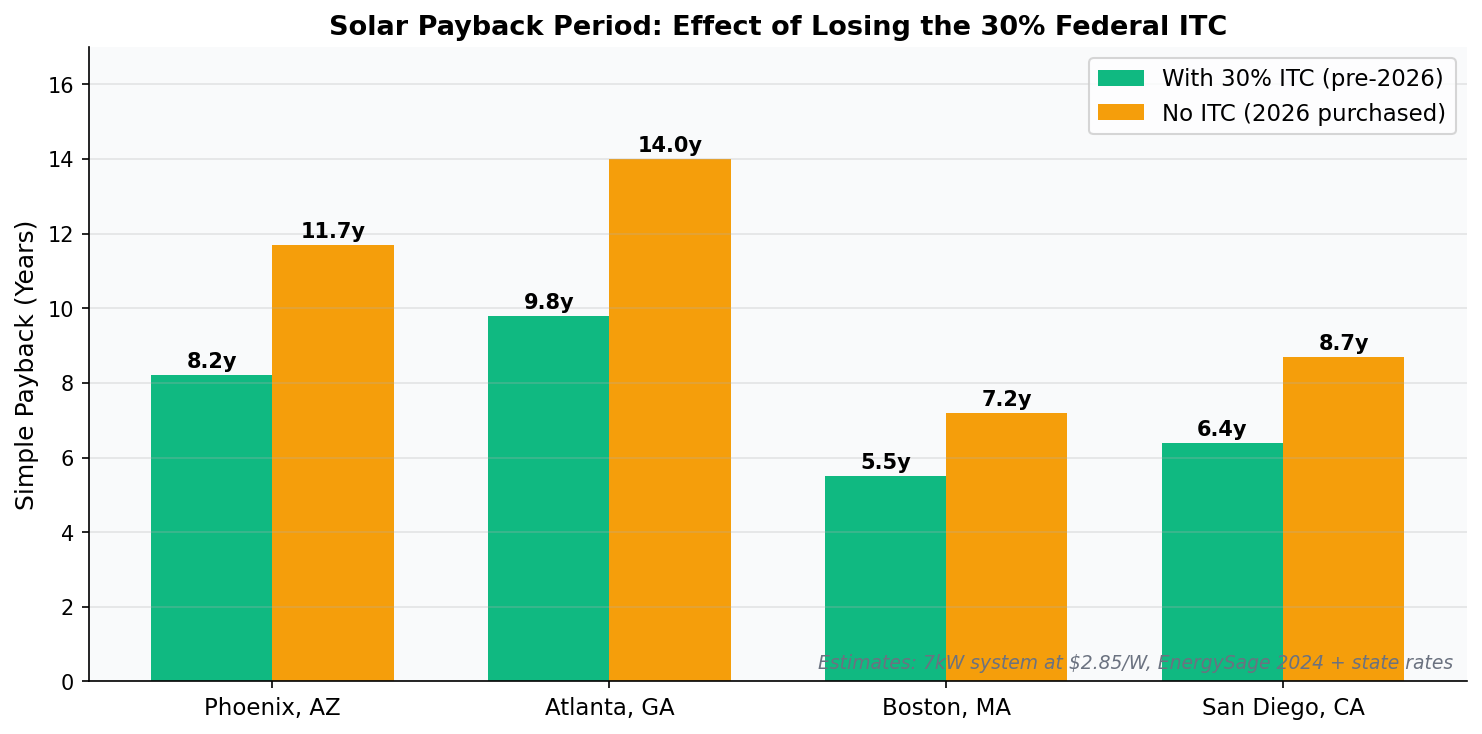
Without the 30% federal credit, the payback math for purchased systems pushes out by about 2 to 3 years in most markets. Here's a Boston example using EnergySage's average pricing:
- Gross system cost: $19,950
- Massachusetts SMART program (10-year payments): roughly $0.04/kWh produced — adds up to about $3,640 over 10 years
- Annual bill offset: $2,803
- Simple payback: roughly 7.2 years (versus 5.5 years with the old ITC)
That's still well inside the 25-year warranty window, and over the full system life the homeowner nets roughly $50,000 in avoided utility spend at current rates. With the 5%–8% annual rate inflation we've been seeing, the lifetime number is likely higher.
Lease vs. buy in 2026
Because the 30% ITC now flows only through third-party-owned systems, the relative attractiveness of leases and PPAs has improved versus 2024. Lawrence Berkeley Lab's 2024 tracking shows that third-party-owned systems made up about 25% of the residential market; that share is expected to climb in 2026 (LBNL Tracking the Sun 2024).
The tradeoffs are well known: buying maximizes lifetime savings but ties up capital; leasing requires no upfront money but the installer keeps the depreciation and ITC benefits. In a no-25D world, the gap between the two narrows, and for homeowners who can't use a tax credit anyway (retirees, lower tax liability), a PPA can come out ahead.
What the Korean cable story actually tells us
Three things, all useful to a US homeowner:
- Grid spending is global and accelerating. The DOE's 2024 National Transmission Needs Study projects the US needs to roughly double transmission capacity by 2040, at a cost of $300 billion to $700 billion (DOE 2024). That cost lands on rate payers.
- Distributed solar is a hedge. Putting generation on your own roof bypasses transmission costs entirely for the kWh you self-consume.
- Storage matters more every year. As utilities restructure rates around time-of-use pricing and demand charges, the value of shifting your own kWh from midday production to evening consumption rises. SGIP, California's NEM 3.0, and Texas's emerging battery markets all reward storage.
How to run your own numbers
The only way to know whether solar makes sense for your roof, your utility, and your usage is to run the math on your specific situation.
EnergyScout's free assessment tool uses NREL's PVWatts model with your address, roof orientation, and shading to estimate kWh production, then layers in your local utility rate to compute monthly savings and payback. It takes about three minutes and there's no signup wall.
For state-by-state and utility-level incentives, the incentive search tool pulls active programs by ZIP code — net metering rules, SREC markets, SGIP-style battery rebates, state income tax credits, and utility-specific rate riders.

And if the numbers pencil, the installer directory shows local companies with NABCEP-certified installers, real customer reviews, and equipment lines they actually carry.
Bottom line
Submarine cables off the coast of Korea aren't directly relevant to a single-family home in Ohio. But they're a reminder of where the world's electricity is going: solar generation is cheap, transmission is expensive, and utilities are spending billions to bridge that gap — money that ultimately comes from your bill.
For homeowners, the answer is the same as it has been: run the numbers on your specific roof, your specific utility rate, and your specific incentive stack. If the payback is reasonable and the warranty math holds, rooftop solar plus a properly sized battery is one of the few household investments that gets more valuable every year as rates climb.
Start with a free estimate at energyscout.org. No phone calls, no high-pressure sales — just the math.
More Articles
Do Solar Panels Work During a Power Outage?
Most homeowners assume solar panels keep the lights on when the grid goes down. The actual answer surprises people — and the fix is simpler than you think.
Read article Battery StorageChile Hit 75% Solar in March. Here's What U.S. Homeowners Should Take From It
Chile's grid produced 29% of its electricity from solar in March, with peaks at 75%. The bottleneck wasn't generation — it was storage and transmission. Here's the homeowner takeaway.
Read article